Download
1 / 128
1.28k likes | 1.29k Views
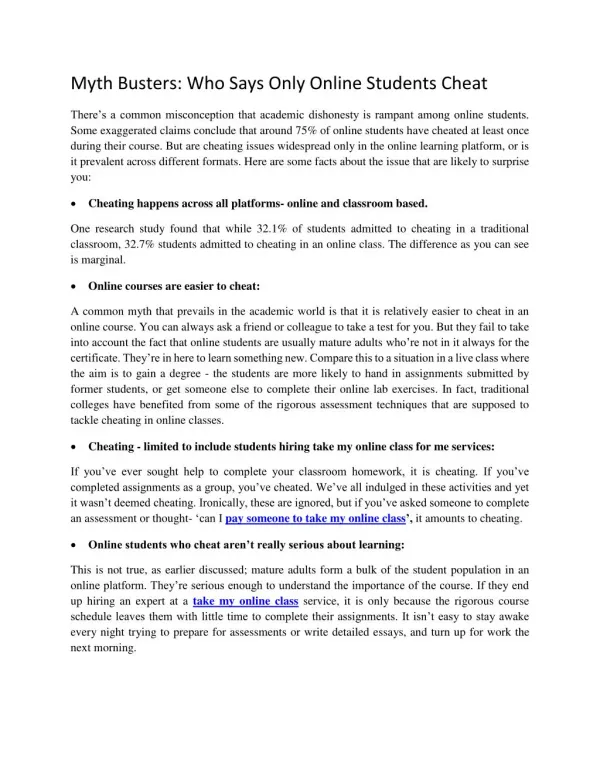
This article explores the common misconceptions surrounding measurement and highlights the importance of validity and reliability. It also discusses the potential biases and threats to external validity in the measurement process.

E N D
Measurement Myth Busters 101 Joe Adams, Ph.D. www.joeadams.net
All measurement contains error. All measures are human creations. All measures require an observer or instrument user. Things to keep in mind:
More things to keep in mind: • Measurement is a discipline. • What do you see? • What do you hear? • How do you look and listen objectivity? • How do you describe/define the observation?
Measures are a shorthand for experience or observations. Knowing your subject matter counts! If they can do it, you can too! Don’t be fooled by naysayers. The Best Measures are Simple
Gilley’s song inspired four teams of researchers to test his hypothesis!
The Beat Goes On… • And so did the research: • On Attractiveness • On Mate Selection • On Stability of Relationships • On Genetic Cues, etc., etc… • On a lot of things you really don’t want to know…
Myth #2: It’s all subjective! “Beauty is in the eye of the beholder!”
The Distorted Cultural Legacy of A.J. Ayer (1910 – 1989) • Language, Truth, and Logic (1936) • The most famous spokesman for the fact/value dichotomy. • Claimed that all statements about values are merely expressions of emotion, with no logical significance. • Also a formidable opponent to Mike Tyson.
Ayer v. Tyson “[Ayer] taught or lectured several times in the United States, including serving as a visiting professor at Bard College in the fall of 1987. At a party that same year held by fashion designer Fernando Sanchez, Ayer, then 77, confronted Mike Tyson harassing the (then little-known) model Naomi Campbell. When Ayer demanded that Tyson stop, the boxer said: "Do you know who the f*** I am? I'm the heavyweight champion of the world," to which Ayer replied: "And I am the former Wykeham Professor of Logic. We are both pre-eminent in our field. I suggest that we talk about this like rational men". Ayer and Tyson then began to talk, while Naomi Campbell slipped out.” - Wikipedia TKO – First Round! Verifiable on Wikipedia
“The fact of twilight does not prevent us from distinguishing between day and night.”Attributed to Dr. Samuel Johnson (1709-1784)
Validity – Relevance - Logic • DESIRALBE QUALITIES: • RELEVANCE: Measures should mean something important to those who use them – performance measures should drive performance! • PURITY: Measures should deal with a clearly defined domain or dimension of a particular quality. • REPRESENTATIVENESS: Measures should capture something about a phenomena without distorting the phenomena.
Invalid Measures • Tend to obscure reality, not illuminate it. • May lead to erroneous, spurious, or absurd conclusions.
In Application of MeasuresInternal Threats to Validity • Selection – picking facts that fit hypothesis • History – observations taken at different times • Maturation Effect – subjects or effects mature • Repeated Testing – subjects get test-wise • Instrumentation – “breaks down” or used incorrectly • Experimental Mortality – people drop out • Experimenter Bias – creates expectations
Threats to External Validity • Generalizability of results may be limited by: • TIME – Sample taken on Fat Tuesday! • SETTING – During the Superbowl. • PLACES – As they come out of Sugars… • PEOPLE (SAMPLE) – Inside Sugars… • OBSERVER – Barney Fife
Threats to External Validity(Continued) • Generalizability of results may be limited by: • Placebo Effect – MSU Health Plan • Novelty Effect – Ooo wow! • Hawthorn Effect – More below.
Summary of Validity Issues • Does the measure capture what you intend it to capture. • Artifacts of measurement
Artifacts of Measuring • Measures that pretend to be one thing, but are actually something else (e.g. pleasing answers). • An artifact might mean that the act of measuring caused something to register that wasn’t there (e.g. questions about non-existent opinions). • The act of measurement disturbs the same reality it is measuring, a problem commonly known as the Heisenberg Principle (interviewers may make people self-conscious).
The Hawthorn Effect • General Electric plant at Hawthorn Works, outside Chicago in Cicero, Illinois • A series of studies done by Harvard professors between 1924 and 1932. • They were testing hypotheses about working conditions and productivity. • Treatment groups increased productivity regardless of conditions…
Why did they improve? • They felt “special” for being chosen to participate in the experiment. • The experiments spawned the whole Human Relations school of thought in the field of management.
The Rosenthal Effect • Studies done by Robert Rosenthal and Lenore Jacobson (1968/1992). • Also called the Pygmalion Effect. • Observer / Teacher expectations improved student results… more than different “treatments.” That’s the good news about teaching: It matters.
Reliability - Consistency • DESIRALBE QUALITIES: • ROBUSTNESS: Measures should work well under of variety of extraneous conditions. • PRECISESNESS: Measures should differentiate between different qualities or gradations. • SENSITIVITY: Measures should detect change.
Intercoder Reliabilty • Inter-coder or inter-rater reliability: The results of two or more people correlation with each other on a particular item, using the same scale or instrument. • Problem: They see the same thing looking through the same lenses (but they were drunk). • In the example from the Girls All Get Prettier at Closing Time, inter-coder reliability on the attractiveness of females typically reaches .90, or 90 percent, depending on how you define reliability. Most research in this area indicate a high degree of consistency from both sexes. Does drinking help?
Internal Consistency • Internal consistency: The result of one measure correlate with other similar, but different, measures measuring the same thing. Problem: Error in the measures may be correlated more than the content.It’s the correlation between the measures that is the key to knowing whether the measures are reliable, but that might be a problem: The observer was drunk again. (GIGO)
Test-retest Reliability • Test-retest reliability: Try measuring the same thing with the same instrument more than once to see if the results are the same. Problem: The Barney Fife problem – the person using the instrument is part of the instrument (retest won’t catch this). • Examples: Racial differences between interviewer and subject may shift responses on surveys dealing with race. Male versus female interviewers asking about sexual issues has the same problem.
Split-Half Reliability • Split-half reliability: Use two equivalent forms of a scale to see if they correlate. Example: Use two different questions in the same survey to measure the same thing. If they are correlated, you’ve demonstrated the reliability of the instrument(s).
Half Goofy: The MMPI • The Minnesota Multiphasic Personality Inventory (1952 - ) • It’s the pattern, not the questions alone. • Different axes (dimensions). • The Diagnostic and Statistical Manual of Mental Disorders (DSM) • Provides standardized diagnoses. • Describes some treatment protocols
Resources for Testing Validity and Reliability • G. David Garson, Quantitative Research in Public Administration http://www2.chass.ncsu.edu/garson/pA765/reliab.htm • Wikipedia, Validity (Statistics) http://en.wikipedia.org/wiki/Validity_%28statistics%29 • Wikipedia, Validity (Logic) http://en.wikipedia.org/wiki/Validity
Myth # 3: Madison Avenue is home to the world’s greatest scientific minds (“Data proves (fill in the blank)”.
How often have you heard: “Scientific research proves….”
Science does not prove, it disproves. • Key things to understand: • In science, a null hypothesis is rejected or accepted. • The outcome of any experiment or statistical comparison counts as only one observation, regardless of the number of data points. • Different observations at different times may yield different results. • Eternity is not ours to observe.
Key References • David Hume (1711 – 1776)– Noted that there is nothing logically necessary about the repetition of a pattern continuing in the future. • Ludwig Wittgenstein (1889 – 1951) – Wrote the Tractatus Logico-Philosophicus, which outlines almost all of the rules of scientific endeavor, one of the most important points of which, is that the notion of causation is a purely intellectual construction and is never a fact.
AKA: The Ecological Fallacy The Level of Measurement Matters (A Logical Validity Issue)
Levels of Analysis: Examples • Individual – a person, single cell, atom, e.g. smallest discrete unit. • Group – may meet face-to-face • Organization – does not generally meet face-to-face • State – a geopolitical jurisdiction • Nation – Like Texas y’all.
Aggregate measures cannot generally be used to estimate disaggregated behavior. • Conclusions about individual-level behavior cannot be drawn from aggregate comparisons. • Example: Emile Durkheim’s Study of Suicide. • Just because more Bavarians commit suicide, Catholics are NOT more likely to commit suicide
Disaggregated data cannot generally be used to estimate aggregate behavior. • Conclusions about aggregate behavior cannot be drawn from individual level data. • Example: Hydrogen and Oxygen burn. H2O does not. • Not ALL Texans carry guns and wear cowboy hats. • Not ALL Austinites wear speedos and ride 10-speeds downtown.
Maybe Not? • Gary King (1997). A Solution to the Ecological Inference Problem, Princeton University Press. Within limits, there may be “probable” statements about inferences between levels. The level of certainty about such statements can be estimated. http://gking.harvard.edu/stats.shtml
Attitudes ≠ Behavior • Classic Case: • LaPiere, Richard T. “Attitudes vs. Actions,” Social Forces, Vol. 13, No. 2. (Dec., 1934), pp. 230-237.
Customer Satisfaction? Case #2 (1983) Cenaré Italian Cuisine 404 East University Drive College Station, Texas The tale of the half-price special!
Dr. Robert A. Peterson • Associate Dean for Research at the University of Texas’ McCombs School of Business Robert A. Peterson and William R. Wilson (1992). Measuring Customer Satisfaction: Fact and Artifact, Journal of the Academy of Marketing Science, Vol. 20, No. 1, 61-71. Customer satisfaction surveys may be measuring how many happy people or unhappy people are in the sample, nothing more.
Myth #6: Quantitative data are different than qualitative data.
Developing Measures “Quantification is merely a second order matching of primary qualities.” Karl Wolfgang Deutsch (1912-1992)
Develop Powerful Measures"!" • Three levels of measurement: • Nominal – The weakest measure • Ordinal – Mediocre, but not awful. • Interval/Ratio – The best possible.
Nominal Measures • Nominal(Categorical)– refers to opaque qualities, color, sex, nationality, groups, etc. Must have no order or rank. Problem: There might be a hidden order to the measure that is not immediately identifiable, particularly in cases where social status may correlate with other measures (income, education, etc.). The existence of some hidden order is an empirical question that can be tested.
Ordinal Measures Interval / Ordinal Measures – have direction or dimension, a greater and lesser ends to the measure. Likert or Guttman Scales, 7-point, 5-point, but no specific distance between points. Example: Scalding, hot, warm, cool, cold, freezing, etc… Problem: Survey question construction may prompt an order (preference among candidates). Randomization is a partial remedy.