Download
1 / 21
210 likes | 325 Views
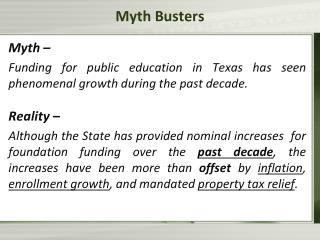
Myth Busters Sorting Fact from Fiction in Texas Public Education. Presenter Name Presenter Title Presenter’s Organization. Overview. “We must shrink government.” “ Public schools are wasteful/inefficient .”

E N D
Myth BustersSorting Fact from Fiction in Texas Public Education Presenter Name Presenter Title Presenter’s Organization
Overview • “We must shrink government.” • “Public schools are wasteful/inefficient.” • “The legislature put more money into to public education last session than ever before.” It’s time for us to combat those myths!
Agenda • Examine the recurring attacks on public schools. • Debunk the myths with “the facts.” • Assist you in becoming effective advocates for your public schools.
“Districts have a Bloated Administration!” Critics claim: • 1:1 ratio of administrators to teachers • 1:1 ratio of non-teachingstaff to teachers • Schools can avoid cutting teachers This implies: • Schools are stocked with do-nothing staff; • Non-instructional staff provide no benefit to student learning; • Schools are mismanaging public funds by cutting teachers rather than administrators/non-teachers.
District Administration – The Facts • During the 2010-11 school year, schools employed 334,900 teachers vs.: • 6,800 central administrators (1:49 administrator to teacher ratio • 25,600 central and school administrators (1:13 administrators to teachers) • Statewide, central administration costs $1.3 billion/year vs. $2.7 billion/year state funding cut • 1:1 teacher/non-teacher ratio is true, but lacks context • Sources: Statewide Academic Excellence Indicator System (TEA) • School District Staffing Brief (gr.tasb.org)
“Superintendent Salaries Are Outrageous” Critics claim: • More than 200 superintendents make more money than the Governor • Superintendent salaries are outrageous This implies: • School trustees are fiscally irresponsible • Texas superintendents are taking taxpayers to the cleaners
Superintendent Salaries – The Facts 2011-12 Superintendent Salaries (Texas) • Average supt. salary in Texas = $123,000 • Median Texas supt. Salary = $107,000 Who else makes more than the Governor? • Four of the Governor’s own staff • 392 individuals on the State of Texas payroll, including the Education Commissioner Robert Scott. Superintendent Salaries (Comparable States) California ($158,000) New York ($163,000) Nation ($160,000). Governor’s non-salary benefits are significant Sources: Texas Tribune Superintendent Salary database TASB’s Superintendent Salary Survey, 2011-12
“Charter Schools Are Better and Cheaper” Critics claim: • Open-enrollment charter schools operate more cost-effectively than traditional public schools • Charter schools academically outperform traditional schools This implies: • The legislature would get “a bigger bang for the buck” by expanding charter schools (and spending less on traditional schools)
Charter Schools – The Facts • For the 2009-10 school year: • Traditional public schools were allotted on average $5,708 in M&O revenue per weighted students • Charters received $5,746 $5,746 > $5,708 • Charters spend more on administration and less on “instruction” than do traditional schools • Accountability Ratings (2009)
“Public Education Got More State Funding Than Last Biennium” Critics claim: • The legislature appropriated $1.6 B more for public schools this biennium than last biennium OR • The legislature appropriated $3B more for public schools this biennium than last biennium • This implies: • School boards and administrators don’t need more money, they just want it! • Programs are being cut, teachers fired, and class sizes are growing just to scare district taxpayers
Public Education Funding – The FactsPart 1 • Disputing the $1.6B. claim: • 2009 – legislature used $3.4B. in one-time federal funds to fund public education • 2011 – loss of federal funds left $3.4B. budget hole for this biennium; so, legislature added $1.6B. more in state funds, leaving a budget hole of $1.8 B; and • 2011 – legislature failed to pay for enrollment growth ($2.2B) over this biennium • Disputing the $3B. claim: • Legislature added $3 B. more state funding than last biennium state in Article III BUT • Simultaneously reduced funding for public ed in Article IX by $3.1 B Source: Summary of Conference Committee On HB1 (Legislative Budget Board)
Public Education Funding – The FactsPart 2 “Total appropriations for the Foundation School Program (FSP) are estimated to be $4.0 billion …below the amount required to fund the school finance program.” “General Revenue Funds outside of the FSP are reduced by $1.4 billion, or 52.8 percent compared to the 2010-11 biennium.” --- Legislative Budget Board “Of the $50.8 billion in all funds, $47 billion is appropriated to TEA, a $4.4 billion decrease from fiscal 2010-11 appropriations. The budget appropriates $35.5 billion in all funds to the Foundation School Program, a decrease of $1 billion from fiscal 2010-11 spending.” --- House Research Organization
“Districts Are Shortchanging Their Students” Critics claim: • Instructional Costs account for less than half of school spending • “School districts are shortchanging their students to support 19th century organizational bureaucracies” • This implies: • Waste, waste, waste… • It’s no wonder that academic performance isn’t on the rise when schools spend less then half of their budget on the classroom
Instructional Spending – The Facts According to the 2010-11 AEIS, Districts spend: • 58.4% of their operating budget on “Instruction” • 4.5% of their operating budget on “Student Support” • 3.6% on “Instructional-Related Services” • 10.4% on Maintenance and operations • 5.2 % on Food Service • 2.7% on Student Transportation • 3.1% on Central Administration • 5.5% on School Leadership Source: Statewide Academic Excellence Indicator System (TEA)
Instructional Spending – The Facts Test Scores have improved dramatically: % of all students, by grade, that met standards – All Tests (TAKS): Texas high schools ranked in the first two places in Newsweek’s annual rankings Texas had 15 high schools in top 100; only New York had more (16) Sources: State Academic Excellence Indicator System, 2002-3 & 2010-11 Newsweek, “America’s Best High Schools,” June, 2011
Let’s Discuss! • Combat the myths: tell your community the facts about your district and schools • Resources : WWW.TRUTHABOUTSCHOOLS.ORG • Stump the Chump • Heard something about your schools that doesn’t sound quite true? Ask me.