Download
1 / 30
300 likes | 303 Views
Report on Channel Model. Chrysovalantis Kosta. Agenda. Wireless Channel Characteristics Path loss Shadowing And how we may simulate these??. Wireless Channel Characteristics. Wireless Channel of different com terminal. Path Loss Large scale Long duration Shadowing Medium Scale

E N D
Report on Channel Model Chrysovalantis Kosta
Agenda • Wireless Channel Characteristics • Path loss • Shadowing • And how we may simulate these??
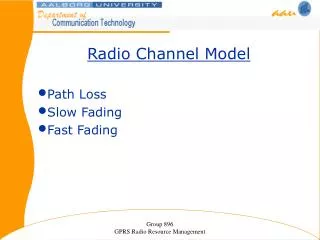
Wireless Channel Characteristics Wireless Channel of different com terminal • Path Loss • Large scale • Long duration • Shadowing • Medium Scale • Medium Duration • Multipath Fading • Small Scale • Small Duration fading effect ? duration ?
Path Loss (Large-scale fading effect) is the path loss in decibels is a constant which accounts for system losses is the path loss exponent is the distance between the transmitter and the receiver, n=3.76 C= 128 • Path Loss • Example • Path Loss for Urban • Free Space Loss C= 127 n=3
Example from LTE simulator 130 20 40 120 60 110 80 100 100 120 140 90 160 80 180 200 70 50 100 150 200 networkPathlossMap.plot_pathloss(cell ID) / .plot_pathloss_all
Shadowing (Medium-Scale Fading effect) • Shadowing (Log-normal fading loss)
Shadowing (Medium-Scale Fading effect) New value Old value • Shadowing (Log-normal fading loss) • 1-D dimensional shadowing
Shadowing (macro-cell diversity ) • As shadowing effects occur over a large area, in order to be able to capture the dynamics affecting macro-cell diversity in a realistic way, a two-dimensional Gaussian process with appropriate spatial correlation is desirable.
Shadowing • Shadowing (Log-normal fading loss) • 2D dimensional shadowing Impulse Response Table Gaussian Table 2D convolution
Evaluation of Shadowing model • Calculating the mean value (should be 0) • Calculating the std value (should be std) • Plotting the histogram
Example from LTE simulator networkPathlossMap.plot_shadowing(cell ID) /.plot_both_path_shawdow_all
Examples from LTE simulator networkPathlossMap.plot_pathloss_all networkPathlossMap.plot_both_path_shawdow_all
Fast Fading Channel Model • The channelmodelconsistsintomobilewirelesschannelwith L movingscatters. • TheFouriertransformofthechannelresponseisthetimevaryingfrequencyresponsewhichcanbedescribedas: • where • hl the complex amplitude • τl time delay of the lth path.
Simulating flat fast fading • Inputs: • Ns : number of samples in the generated fading impulse response • Ts : Sampling Interval in seconds • Fd : Maximum Doppler Frequency in Hz • M : # of Sinusoids • Output: • Gt : complex channel impulse response =
Modeling flat fast fading (Matthias method ) M Fd Ns & Ts
Evaluation of flat fast fading channel model • Phase 1 • Autocorrelation of Real part (Fig.1) • Autocorrelation of Imag. part (Fig.2) • Cross correlation of Real part (Fig.3) • Autocorrelation of Amplitude (Fig.4) • Phase 2 • Normalized LCR (Level crossing rate) (Fig.5) • Normalized AFD (Average Fading Dur.) (Fig.6) • Fading Amplitude Fig.7
Matthias Patzold Autocorrelation of Real part Autocorrelation of Imag. part Cross correlation of Real part Autocorrelation of Amplitude
Jakes Model Autocorrelation of Real part Autocorrelation of Imag. part Cross correlation of Real part Autocorrelation of Amplitude
Yahong Autocorrelation of Real part Autocorrelation of Imag. part Cross correlation of Real part Autocorrelation of Amplitude
Optimal Autocorrelation of Real part Autocorrelation of Imag. part Cross correlation of Real part Autocorrelation of Amplitude
Matthias Patzold Average Fading Duration Level crossing rate Fading Amplitude
Jakes Model Average Fading Duration Level crossing rate Fading Amplitude
Yahong Average Fading Duration Level crossing rate Fading Amplitude
Channel Impulse Response Signal power in dB Delay of each path in sec
Simulating Selective Fading • Simulate multiple flat fading layers • Multiply and shift according to the channel profile • (in terms of multipath signal strength and delay)
Example of ITU model using PedB • Doppler frequency at 100Hz • Sampling interval 1/1920000 • Number of Samples 4000 • Number of Sinusoids 10