Download
1 / 43
430 likes | 440 Views
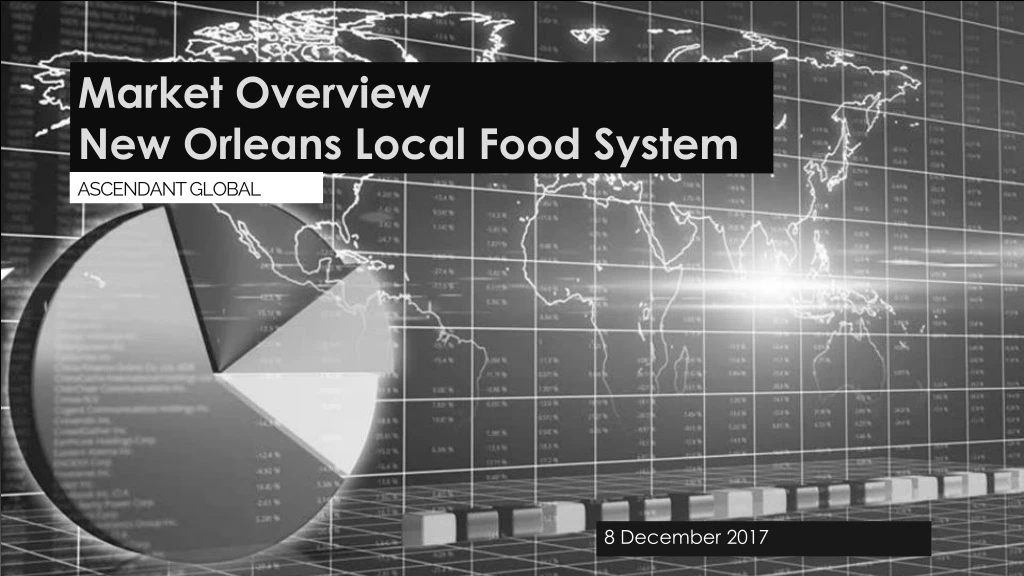
Market Overview New Orleans Local Food System. Market Overview New Orleans Local Food System. ASCENDANT GLOBAL. 8 December 2017. Overview. Scope Approach Data Review Interviews Best Practices Opportunities & Recommendations Data Trends & Data Limitations

E N D
Market OverviewNew Orleans Local Food System Market OverviewNew Orleans Local Food System ASCENDANT GLOBAL 8 December 2017
Overview • Scope • Approach • Data Review Interviews Best Practices Opportunities & Recommendations • Data Trends & Data Limitations • Summary of Interview Findings • Producers • Distributors and Purchasers • National Models/Best Practices • Opportunities & Recommendations • Next Steps
Scope • AG to assist in identifying opportunities for institutional purchase of locally sourced food products, using quantitative data analysis and qualitative measures. • AG endeavors to providePropeller and Wallace Center with the information and support needed to achieve the following outcomes: • Have the needed understanding and information around the local food sector and ecosystem to lead the conversation around local food access in New Orleans; and • Identification of key opportunities to support further strategy development and implementation; and • Connections to key relationships to engage in a deeper discussion with relevant political, business, and civic leadership in the sector; and • Have concrete next steps and big picture strategies to launch a quality food sector strategy.
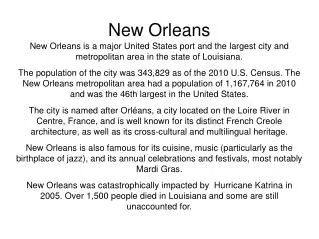
Approach & Project Parameters • Local for purposes of this exercise: 200 mile radius of New Orleans • 94 Parishes/Counties – 45 in LA, 40 in MS, 7 in AL, and 2 in FL • 2016 total population – 6.8M • Quantitative analysis included review of data from USDA and LSU Ag • Qualitative assessment as byproduct of interviews to date which included: • 8 producers, 2 distributors, 5 anchors, 6 supportive institutions *Counties are included if their center of population point falls within the selected radius. The whole county is included and the data are not apportioned to exclude the portions falling outside of the radius. Source: StatsAmerica.org
Local Food Sector and Ecosystem • There are numerous restaurants, grocery stores, schools, universities, hospitals, and others that represent significant purchasers of food products. • We primarily focused on large institutions, given their stability & broad community reach. • Large institutions have significant food budgets • One local anchor has an annual food budget of $1-2+M • Another local anchor orders $6+K of produce per day during the majority of the year • Another anchor purchases $3.5M in food related products, with produce making up $500 - $750K of that • Most local anchors are seeing the majority of their needs met with large national distributors • They also use local distributors to assist in meeting their needs, but local distributors are not always able to provide local produce
Local Food Sector and Ecosystem • There seems to be openness and/or interest on the demand side for greater locally sourced options • Most anchors and food service companies have missions of sustainability • Roughly 1/3 of Louisiana schools participate in farm to school activities • Many schools have requirements in food contracts for 5-10% local purchase • This can often be met by dairy Source: https://farmtoschoolcensus.fns.usda.gov/find-your-school-district/louisiana
Local Food Sector and Ecosystem • There is not a clear single organization or formalized collaborative leading coordination of the overall food ecosystem. • Many challenges in connecting suppliers with opportunities are a byproduct of limited resources and capacity which could be offset with greater organizational supports. • Local organizations which are providing direct resources in this area include LSU Ag, Market Umbrella, FPAC, Propeller, CLEDA, Cooperatives, and many others. • The hurdle of communication and relationships between supplier and purchasers may be facilitated more effectively through leveraging technology. • Regulatory compliance, product safety, and consistent quality remain the most uncertain factors inhibiting greater activity between local producers and purchasers.
Data Trends • National Data: • 75% of farms had sales of less than $50,000, although per farm average sales increased by 52% to $187,000/year in 2012. This signals that larger farms had increased production and revenue. • Middle-sized farms declined in number between 2007 and 2012, large (1,000+ acres) and very small (1-9 acres) farms did not change significantly • Louisiana Data: • In 2016, gross farm value and value-added activities (cleaning, processing) were estimated to have a total economic impact of nearly $11Billion. (8% reduction from 2015) • Agricultural revenues in the state from 2002 to 2012 increased significantly: revenue from crops has nearly tripled ($1B in 2002 to $2.8B in 2012) and livestock from $0.75B to $1B. • Despite fluctuations from year to year, overall total farm acreage in Louisiana has remained around slightly under 8M acres from 2002 to 2012. Source: USDA NASS, 2012; LSU Ag Center 2016 Louisiana Summary, gross value as indicator of commodity’s contribution to economic activity but was not an indicator of farm profits
Data Trends – National Demographics • Increasing minority participation and aging operators Minority Principal Operators, 2007 & 2012 Average Age of Principal Operator, 1997-2012 Source: USDA NASS 2012
Data Trends – State Demographics • Mirroring national trends, minority operated farms grew between 2007-2012 Minority Principal Operators, 2007 & 2012 • *Chart does not include farms operated by white operators which dropped from 28,149 in 2007(94% of the total) to 25,681 in 2012 (91% of total) Source: USDA NASS 2007, 2012.
Data Trends – State Demographics • LA average market value of crops increased 156% from 2007 to 2012 • Minority-operated farms did not see increases that high and some decreased Farm Earnings by Principal Operator Demography, 2007 & 2012 26% decrease 156% increase 159% increase 128% increase 39% decrease 136% increase Source: USDA NASS 2007, 2012.
Data Trends – State Demographics • State trends lag slightly behind national trends, with minorities tending to own farms with lower market value Share of Farms by Market Value $100K+ & Operator Demographic 2012 Share of Farms by Market Value <$10K+ & Operator Demographic 2012 Source: USDA NASS, 2012.
Data Trends Local • Louisiana Local Data (45 parishes): • Gross farm value of $7.5B in 2014 • Plant based enterprises represent 61% of gross farm value, Fisheries and Wildlife Enterprises represented 10%, and Animal Enterprises represent 29% of the $7.5B Gross Farm Value in 2014; reflects state average breakdowns • Five most planted crops are soybeans, sugarcane, rice, corn, and hay: represents 2.3M acres of farm production Source: LSU Ag Center Louisiana Summary Agricultural And Natural Resources 2014, gross value as indicator of commodity’s contribution to economic activity but was not an indicator of farm profits
Highest Local Value Items for Consumption • Highest Gross Farm Value (GFV) in 2014 were rice, sweet potatoes, strawberries, tomatoes, pecans, sweet corn, watermelons, citrus and peppers. *Table excludes rice, which had GFV of $430M. Source: LSU Ag Center Louisiana Summary Agricultural And Natural Resources 2014; Gross Farm Value (GFV) calculated using calendar-year, market-weighted, state-level average prices, when available. GVF as indicator of commodity’s contribution to economic activity, not indicator of farm profits as production costs greatly affected profit (or loss) for all commodities.
Largest Acreage for Items for Consumption • The most planted items in 2014 were rice, tomatoes, pecans and cucumbers • Mismatch between value and acreage: • Cucumbers (large acreage, low value); Sweet potatoes & Strawberries(low acreage, high value) *Table excludes rice (382K acres) & tomatoes (120K acres) Source: LSU Ag Center Louisiana Summary Agricultural And Natural Resources 2014
Data Limits • Census of Agriculture Data has a variety of data points from 2012 • Taken every 5 years and based off self-reporting • Farm defined as any plot of land selling $1,000 or more of products in a given year • Looks at land use and ownership, operator characteristics, production practices, income and expenditures • LSU Ag has state data sets from 2014 • Compiled from estimates made by extension agents after consulting with agricultural agency representatives, agricultural and agribusiness leaders and others and after study of various reports and resource materials. • Information on Gross Farm Value, Acres Planted, and Number of Producers • USDA has annual agriculture reports for state and parish • State level data • Parish level data is only available for largest crops (soybeans, sugarcane, corn, cotton, rice, etc.)
Interview Findings: Producers • Most producers were interested in expanding if they knew there was a market for their products • Difficulty in forecasting sales remain a significant impediment to more aggressive production • Large buyers will rarely commit via contract to purchasing crops beforehand due to fluctuations in demand and uncertainty regarding quality & quantity • Regulatory challenges/concerns seemed to be most significant hurdle to pursuing larger anchor clients • Food Safety Certifications • Insurance • Fears of being audited or other record keeping limitations
Interview Findings: Producers, cont’d • Other issues limiting expansion for producers primarily relate to capacity and relationships • Lack of clear channels to secure commercial purchasers • Logistics issues related to transportation, refrigeration, storage and packaging • Challenges related to consistent quality control
Interview Findings: Distributors/Purchasers • Most purchasers and distributors seemed to have a consistent interest in securing more locally sourced foods, with price as an issue but with some potential flexibility • Challenges to meet the food needs with local suppliers • Price is an issue • For certain products, especially specialty local products, price was secondary to quality and quantity • Several large institutions have multi-year contracts with food service providers, and they have not yet made local food purchasing a part of that contractual agreement • Some food service providers are open to more local food (price, quality, quantity concerns)
Interview Findings: Distributors/Purchasers, cont’d • Lack of certified farmers in the local food system • There are 19 GAP/GHP-Certified famers in LA, 13 of which produce only sweet potatoes • Difficult to get consistent product at their needed scale • Most local farms grow a variety of fruits and vegetables during growing season (CSA/Farmer’s Market, etc.) • Challenges finding and dealing with local farmers • Difficult to connect with producers/technological challenges • Scalability and Reliability of products is a major impediment in moving forward Source: USDA: https://www.ams.usda.gov/services/auditing/gap-ghp
Cleveland: Increased Local Food Purchase • City of Cleveland • Local & Sustainable Purchasing Ordinance • Provides 2-4% bid discounts on all applicable City contracts to businesses that are sustainable, locally-based, and/or purchase at least 20% of their contract amounts from regional food growers • Cleveland Clinic • Goal to have at least 10% of food produced within a 200-mile radius • Hosts farmer’s market • Began procuring more food locally in 2008 and has forged relationships with regional farmers Source: city.cleveland.oh.us, my.clevelandclinic.org, http://community-wealth.org/sites/clone.community-wealth.org/files/downloads/ExcerptHospitalsBuildingHealthierCommunities-ClevelandClinic.pdf
Ecotrust: Oregon Farm to Institution Nonprofit • Rebuilding Agriculture of the Middle– farmers’ market values at wholesale scale • Broad category of small and mid-sized farms and ranches that want to sell locally and are larger than those selling via local farmers’ markets or CSAs, but smaller than those supplying globalized commodity markets, and who want to sell locally. • Working hub offers warehousing, cold storage, distribution, fulfillment, CSA/CSF drop sites, and office, co-working, and meeting space; licensed commercial kitchen space also be available. • Helps curate annual food show specifically designed to connect mid-sized, socially responsible, local producers directly with chefs and foodservice directors at local institutions • Coordinates development of scale-appropriate aggregation, processing, and distribution infrastructure to move food within regions • Supports family-scale farmers, ranchers, fishermen, and food processors to access land, capital, and technical assistance needed to feed their communities and steward their land Source: http://civileats.com/2016/08/29/forget-farm-to-table-its-farm-to-institution-sourcing-that-could-make-a-real-dent-the-food-system/
Food LINC (Leveraging Investment for Network Coordination) • Food value chains require mutual trust, shared values, open communication and concern for the viability of all members along the chain, from producer to consumer • Food LINC brings together multiple USDA agencies and 18 private foundations to fund 13 value chain coordinators • Linking rural producers to urban markets with demand • 18 Philanthropic Partners contributed $2.8M and Federal Partners funded $2.7M • VCCs are trying to achieve same goal in regions with different geographies, demographics, and economies and the organizations that house them are also diverse in size, experience, and capacity. • Wallace Center created Community of Practice among the 13 VCCs. • Role of the VCC as Market Matchmaker, Relationship Builder, TA provider, Policy Thought Leader, Resource Prospector and Catalyst
Local Policy • Fresh Food Retailer Initiative in New Orleans • Focused on funding grocery stores in under-served areas • Farm to School Initiative • Many school food contracts include 5-10% local purchase requirements • Federal payments for meals are very low – likely hard to meet local produce requirements in meal plans due to costs • The local food system is not currently part of the city/regional/state economic development planning and discussion • The Regional Planning Commission is drafting the Comprehensive Economic Development Strategy and is asking for comment/interviews from food-related businesses
Highlights of Local Activities • Liberty’s Kitchen pilot program with schools (FFVP) to deliver Fresh Fruit (citrus) to schools they serve (partners with Market Umbrella, Top Box, Propeller, and others) • Healthy Corner Store Initiative (City, Propeller, Liberty’s Kitchen, Top Box), provides 5 corner stores throughout NOLA with access to fresh produce supply to make fresh, healthy foods more accessible to families • LSU Ag Program Harvest of the Month pilot program: delivers fresh local fruits and vegetables one day each month to participating schools, crop is highlighted in educational materials • Goal to increase access & consumers’ preference for fruits and vegetables and expand familiarity with local fruits and vegetables & local farmers • LSU Ag provides technical assistance for Food Safety Certifications (workshops, financial help) • New Orleans Eat Local Challenge: Challenges residents to go 30 days in June eating only foods from within 200 miles with goal to raise awareness of nutritional, economical, environmental and cultural benefits of eating locally sourced foods
Opportunities and Recommendations • Opportunity: purchasers and distributors want to fill more of their food needs from local producers • Recommendation 1: Facilitate Relationship Development • Importance of facilitating, fostering and enabling relationships between farmers and purchasers which will assist in creating a certainty of market • Launch Pilot program between local producers and anchors • Facilitate planning and communication with producers to maintain a steady flow of products and warn buyers ahead of time about shortage • Recommendation 2: Facilitate a 1-day tradeshow event (could become regular occurrence) • Producers and distributors/purchasers would attend and complete and share spec sheets • All parties must be transparent (purchasers/distributors around policies, specs and timelines, safety certifications required, etc.)
Opportunities and Recommendations • Opportunity: local producers want to increase their technical skills and capacity for growth • Recommendation 1: Capacity Building & Ecosystem Development • Food Safety/Certifications Technical Assistance • Work with farmers on how they best receive training/assistance • Potential for back-office assistance, technical assistance, and logistics support • Assistance in getting and staying certified • Assist institutions and purchasers to create checklist for producers encompassing food safety, communications/agreements, processing & packaging, and distribution & delivery • Expand on and formalize the many good things happening with local & regional advocates • Recommendation 2: Logistics Assistance (packaging, shipping, storage, etc.) • Potential introduction of technology/software app to connect farmers and fishermen to distributors and purchasers, with real-time data/info about products and buyer feedback • Develop better, scalable mechanisms for tracking local products in real time and labeling • products that are local to improve traceability • Collaborative or cooperatives between farms to provided shared logistics support
Opportunities and Recommendations • Opportunity: purchasers and consumers want to know more about locally sourced products • Recommendation 1: Launch “Buy Local” Campaign • Raise awareness of benefits of local products such as freshness, seasonality, nutritive value, local economic capture, and environmental benefits. • Recommendation 2: Partner with the Network for Economic Opportunity • Integrate scaling local food access program into other citywide anchor institution efforts • Recommendation 3: Partner with Universities and Hospitals • Offer local farmers markets that provide fresh food in addition to education around fresh food value
Immediate and Near Term Next Steps • Immediate Next Steps • Send contact information to attendees • Connect attendees who asked to be linked in their survey • Contact everyone who expressed pilot interest to confirm interest and gather baseline data • Near Term Next Steps • Begin work on making pilot linkages • Product, Pricing, Timing, Quantity, etc. • Gather info from Liberty’s Kitchen and Market Umbrella about their pilot • Gather very detailed information from producers and buyers/distributors • Propose regular convenings for stakeholders • Meetings could be structured thematically and used to review pilot program • Building off pilot, broader linkages could be made at a trade show event • Requires planning and facilitation with completed spec sheets by buyers and producers
Longer Term Next Steps • Longer Term Steps • Strategic Plan • Driven by partners in concert with local and regional officials • Examine economic inclusion, economic outputs, sustainability, education, health outcomes, market value and value chain coordination • Identify what is needed for ecosystem growth and who is responsible and how the work and players are connected • Partners enter into agreements and meet regularly to review benchmarks • If one organization is taking a clear lead, it can help identify partners to assist
Longer Term Next Steps • Longer Term Steps • Ecosystem: Support Organization, Policy, Technical Assistance, Marketing • Designate “go-to” support organization for the local food system • Engage in advocacy and policy • Potential lobbying support from local/regional business groups • Technical assistance and capacity building • TA for institutional procurement and broader capacity building • Coordination along food chain • Marketing & Education • Buy local campaign
Contact Information • Rodrick T. Miller • President and CEO • Ascendant Global • rodrickmiller@ascendantgc.com • Alice M. Allen • Managing Director • Ascendant Global • alice@ascendantgc.com
Appendix • GHP/GAP Information and Local Certified Farm List • Additional Data Sets
GAP/GHP • Good Agricultural Practices (GAP) & Good Handling Practices (GHP) • Good Agricultural Practices (GAP) and Good Handling Practices (GHP) are voluntary audits that verify that fruits and vegetables are produced, packed, handled, and stored as safely as possible to minimize risks of microbial food safety hazards. GAP & GHP audits verify adherence to the recommendations made in the U.S. Food and Drug Administration’s Guide to Minimize Microbial Food Safety Hazards for Fresh Fruits and Vegetables and industry recognized food safety practices. • GroupGAP is a USDA farm food safety program that provides the entire specialty crops industry the opportunity to supply and buy fruits, vegetables, and related products that are certified as being produced using Good Agricultural Practices (GAP). By allowing allows farmers, food hubs, and marketing organizations of all sizes to band together and pool resources to achieve USDA GAP certification, GroupGAP is helping more farmers supply fresh, local produce to retail and institutional markets, and providing buyers and consumers alike with more purchasing and product options Source: USDA: https://www.ams.usda.gov/services/auditing/gap-ghp
Local (LA) GAP/GHP Certified Farms • 19 in the state of Louisiana, 9 in our local area (200 miles of New Orleans) • Southern City Farm, Elmwood; covers Various Vegetables and Herbs • Descant, Franklinton; covers basil, Beans, Blueberries, Broccoli, Cabbage, Cauliflower, Corn, Eggplant, Lettuce, Okra, Peas, Peppers, Pumpkins, Squash, Tomatoes, Turnips, Watermelons • Star Nursery, Belle Chase; covers Blueberries, Navel Oranges, Oranges • Faust Farms, Amite; covers Eggplant, Lettuce, Peppers, Strawberries, Tomatoes • Helical Outpost Farms, LLC, Lafayette; covers Lettuce, Microgreens, Tomatoes, Various Herbs • Graham Farms, Palmetto; covers Sweet potatoes • James Deshotel Produce, Bunkie; covers Sweet potatoes • Todd Cullen Farms d/b/a M. Richard and Son, Evergreen; covers Sweet potatoes • Earl Roy Enterprises, Hessmer; covers Sweet potatoes Source: USDA: https://www.ams.usda.gov/services/auditing/gap-ghp
Large Local Farming Parishes • Large defined as those parishes with either 1,000+ farms or 200,000+ acres of farmland • 16 in LA, 2 in MS • 4.25 Million Acres in Farms • Only 8% of farms are 1,000 acres or more • 47% of farms have sales of less than $2500 • 12% of farms have sales of more than $100,000 Source: USDA NASS, 2012
Average Farm Size in Large Farming Parishes Source: USDA NASS, 2012
Farm Size Breakdown in Lg. Farming Parishes Source: USDA NASS, 2012
Value of Sales, Farms in Lg. Farming Parishes Source: USDA NASS, 2012