Download
1 / 20
200 likes | 208 Views
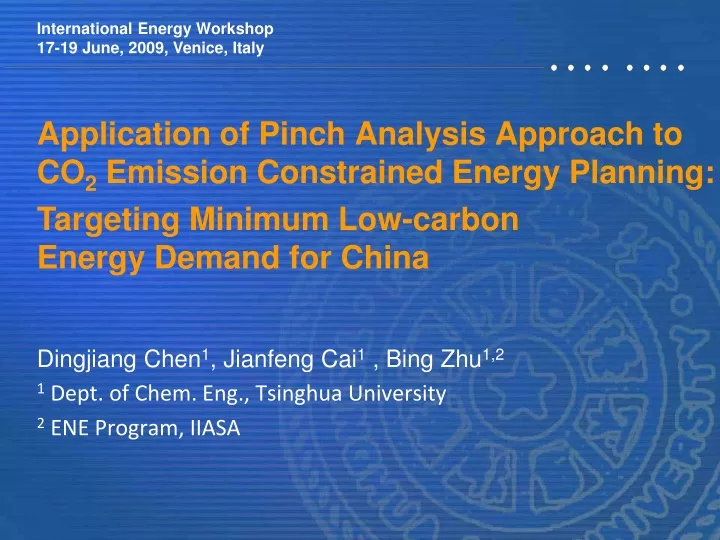
Application o f Pinch Analysis Approach t o CO 2 Emission Constrained Energy Planning :. Dingjiang Chen 1 , Jianfeng Cai 1 , Bing Zhu 1,2 1 Dept. of Chem. Eng., Tsinghua University 2 ENE Program, IIASA. International Energy Workshop 17-19 June, 2009, Venice, Italy.

E N D
Application of Pinch Analysis Approach to CO2 Emission Constrained Energy Planning: Dingjiang Chen1, Jianfeng Cai1 , Bing Zhu1,2 1 Dept. of Chem. Eng., Tsinghua University 2 ENE Program, IIASA International Energy Workshop 17-19 June, 2009, Venice, Italy Targeting Minimum Low-carbon Energy Demand for China
Outline • Introduction of pinch analysis approach • Scenarios: the minimum low-carbon energy demand for China in 2030 with certain CO2 emission constraints • Study regional carbon trades with pinch analysis approach
Graphical Pinch Analysis • To identify the bottleneck (pinch point) between the supplyand the demand,so as to satisfy specific target with minimum utilities。 • Intuitive and with clear physical meaning • Suitable for primary planning • Can’t handle complicated constraints utility QCmin T DTmin supply bottleneck demand QCmin H utility Heat Exchange Network Pinch Analysis
Graphical Carbon Pinch Analysis Extra high-carbon energy usage • Supply composite curve • Demand composite curve • Carbon pinch point • Minimum low-carbon energy usage • Extra high-carbon energy usage Energy demand composite curve Coal Region III CO2 emission (million tons) CO2 emission limit Region II Pinch point Oil Region I Energy supply composite curve NG Energy (TJ) Minimum low-carbon energy usage Tan RR, Foo DCY. Pinch analysis approach to carbon-constrained energy sector planning. Energy, 2007,32(8):1422-1429.
To Construct Energy Supply Composite Curve Si Cout,i Cout,i Coal CO2 emission (million tons) Si Oil NG Energy (TJ)
To Construct Energy Demand Composite Curve aggregated energy demand composite curve Dj Cin,j Cin,j Region III CO2 emission (million tons) Dj Region II Region I
An example P - total population C - total CO2 emission limit Cj - CO2 emission limit of region j Pj - population of region j Ej (Dj) - energy consumption (Demand) for region j Regional CO2 Emission Factor CO2 emission limit of region j tgq = Cin,j = Energy consumption of region j Dj Cin,j Cin,j What’s the rule to allocate share of total CO2 emission limit to a region ? Dj
Rules of Allocating Regional CO2 Emission Limit Population (P) GDP (G) Energy consumption (E) According to CO2 emission limit of region j (DjCin,j) Regional CO2 Emission Factor(Cin,j)
Is the Regional CO2 Emission Allocation Rule Fair? Provinces in China Regional CO2 Emission Factor(Cin,j) (low) (high) Developing Areas Developed Areas (high) (low)
Scenarios: the minimum low-carbon energy demand for China in 2030 with certain CO2 emission constraints 2
Aggregated Planning with Overall Emission Limits 10220 7 tons per capita CO2 emission x 14.6 billion people CO2 Emission (Million Tons) 5461 Energy (Million Tons of Coal of Equivalent) 1350 Data source of energy resource supply, demand, and estimated population : IEA. World Energy Outlook 2007. The Reference Scenario for China
Aggregated Planning with Overall Emission Limits 11680 10220 8 tons per capita CO2 emission x 14.6 billion people CO2 Emission (Million Tons) 5461 800 Energy (Million Tons of Coal of Equivalent) 1350
Aggregated Planning with Overall Emission Limits 8.4 tons per capita CO2 emission x 14.6 billion people CO2 Emission (Million Tons) the CO2 emission constraint that China can endure according to IEA’s reference scenario data 5461 Energy (Million Tons of Coal of Equivalent) 580 800 1350
Disaggregated Planning with Individual Regional Emission Limits CO2 Emission (Million Tons) 5461 Energy (Million Tons of Coal of Equivalent) 1350 ~15% extra cost of low-carbon energy in order to satisfy each of the regional CO2 emission limits 1550 Data of China regional energy demand in 2030 are estimated from China Eenergy Statistical Yearbook2007.
Regional Carbon Trade above pinch point DC DC Regional Carbon Trade below pinch point DC DC To Reduce the Extra Low-Carbon Energy Cost through Regional Carbon Trade CO2 emission Regional carbon trade Energy Regional Carbon Trade across pinch point
CO2 Emission (Million Tons) Energy (Million Tons of COE) • Implied policy preference • Encouraging reduction of energy consumption per GDP unit • However, more restriction to developing regions
Concluding Remarks • The graphical carbon pinch analysis is intuitive for primary regional energy planning with CO2 emission constraints. • There is extra cost of low-carbon energy when to satisfy regional CO2 emission constraints. • Regional carbon trade may help reducing the extra cost. • Policy to allocate regional CO2 emission limit has to be carefully designed to make balance between economic development and carbon emission control.