Download
1 / 23
240 likes | 363 Views
Remote Sensing and Image Processing: 10. Dr. Mathias (Mat) Disney UCL Geography Office: 301, 3rd Floor, Chandler House Tel: 7670 4290 (x24290) Email: mdisney@geog.ucl.ac.uk www.geog.ucl.ac.uk/~mdisney. Revision: Lecture 1. Introductions and definitions

E N D
Remote Sensing and Image Processing: 10 Dr. Mathias (Mat) Disney UCL Geography Office: 301, 3rd Floor, Chandler House Tel: 7670 4290 (x24290) Email: mdisney@geog.ucl.ac.uk www.geog.ucl.ac.uk/~mdisney
Revision: Lecture 1 • Introductions and definitions • EO/RS is obtaining information at a distance from target • Spatial, spectral, temporal, angular, polarization etc. • Measure reflected / emitted / backscattered EMR and INFER biophysical properties from these • Range of platforms and applications, sensors, types of remote sensing (active / passive) • Why EO? • Global coverage (potentially), synoptic, repeatable…. • Can do in inaccessible regions
Lecture 1 • Intro to EM spectrum • Continuous range of • …UV, Visible, near IR, thermal, microwave, radio… • shorter (higher f) == higher energy • longer (lower f) == lower energy
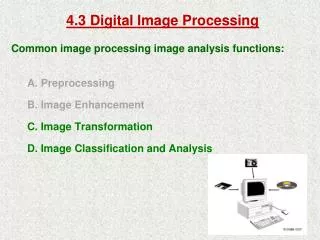
Lecture 2 • Image processing • NOT same as remote sensing • Display and enhancement; information extraction • Display • Colour composites of different bands • E.g. standard false colour composite (NIR, R, G on red, green, blue to highlight vegetation) • Colour composites of different dates • Density slicing, thresholding • Enhancement • Histogram manipulation • Make better use of dynamic range via histogram stretching, histogram equalisation etc.
Lecture 3: Blackbody concept & EMR • Blackbody • Absorbs and re-radiates all radiation incident upon it at maximum possible rate per unit area (Wm-2), at each wavelength, , for a given temperature T (in K) • Total emitted radiation from a blackbody, M, described by Stefan-Boltzmann Law M = T4 • TSun 6000K M,sun 73.5 MWm-2 • TEarth 300K M, Earth 460 Wm-2 • Wien’s Law (Displacement Law) • Energy per unit wavelength E() is function of T and • As T↓ peak of emitted radiation gets longer • For blackbodies at different T, note mT is constant, k = 2897mK i.e. m = k/T • m, sun = 0.48m • m, Earth = 9.66m
Planck’s Law • Explains/predicts shape of blackbody curve • Use to predict how much energy lies between given • Crucial for remote sensing as it tells us how energy is distributed across EM spectrum http://hyperphysics.phy-astr.gsu.edu/hbase/bbrc.html#c1
Lecture 4: image arithmetic and Vegetation Indices (VIs) • Basis:
Why VIs? • Empirical relationships with range of vegetation / climatological parameters • fAPAR – fraction of absorbed photosynthetically active radiation (the bit of solar EM spectrum plants use) • NPP – net primary productivity (net gain of biomass by growing plants) • simple to understand/implement • fast – per scene operation (ratio, difference etc.), not per pixel (unlike spatial filtering)
Some VIs • RVI (ratio) • DVI (difference) • NDVI NDVI = Normalised Difference Vegetation Index i.e. combine RVI and DVI
limitations of NDVI • NDVI is empirical i.e. no physical meaning • atmospheric effects: • esp. aerosols (turbid - decrease) • Correct via direct methods - atmospheric correction or indirect methods e.g. new idices e.g. atmos.-resistant VI (ARVI/GEMI) • sun-target-sensor effects (BRDF): • Max. value composite (MVC) - ok on cloud, not so effective on BRDF • saturation problems !!! • saturates at LAI of > 3
Lecture 5: atmosphere and surface interactions • Top-of-atmosphere (TOA) signal is NOT target signal • function of target reflectance • plus atmospheric component (scattering, absorption) • need to choose appropriate regions of EM spectrum to view target (atmospheric windows) • Surface reflectance is anisotropic • i.e. looks different in different directions • described by BRDF • angular signal contains information on size, shape and distribution of objects on surface
Atmospheric windows • If you want to look at surface • Look in atmospheric windows where transmissions high • BUT if you want to look at atmosphere ....pick gaps • Very important when selecting instrument channels • Note atmosphere nearly transparent in wave i.e. can see through clouds! • BIG advantage of wave remote sensing
Lecture 6: Spatial filtering • Spatial filters divided into two broad categories • Feature detection e.g. edges • High pass filter • Image enhancement e.g. smoothing “speckly” data e.g. RADAR • Low pass filters
Lecture 7: Resolution • Spatial resolution • Ability to separate objects spatially (function of optics and orbit) • Spectral resolution • location, width and sensitivity of chosen bands (function of detector and filters) • Temporal resolution • time between observations (function of orbit and swath width) • Radiometric resolution • precision of observations (NOT accuracy!) (determined by detector sensitivity and quantisation)
Low v high resolution? • Tradeoff of coverage v detail (and data volume) • Spatial resolution? • Low spatial resolution means can cover wider area • High res. gives more detail BUT may be too much data (and less energy per pixel) • Spectral resolution? • Broad bands = less spectral detail BUT greater energy per band • Dictated by sensor application • visible, SWIR, IR, thermal?? From http://modis.gsfc.nasa.gov/about/specs.html
Lecture 8: temporal sampling • Sensor orbit • geostationary orbit - over same spot • BUT distance means entire hemisphere is viewed e.g. METEOSAT • polar orbit can use Earth rotation to view entire surface • Sensor swath • Wide swath allows more rapid revisit • typical of moderate res. instruments for regional/global applications • Narrow swath == longer revisit times • typical of higher resolution for regional to local applications
Tradeoffs • Tradeoffs always made over resolutions…. • We almost always have to achieve compromise between greater detail (spatial, spectral, temporal, angular etc) and range of coverage • Can’t cover globe at 1cm resolution – too much information! • Resolution determined by application (and limitations of sensor design, orbit, cost etc.)
Lecture 9: vegetation and terrestrial carbon cycle • Terrestrial carbon cycle is global • Primary impact on surface is vegetation / soil system • So need monitoring at large scales, regularly, and some way of monitoring vegetation…… • Hence remote sensing in conjunction with in situ measurement and modelling
Vegetation and carbon • We can use complex models of carbon cycle • Driven by climate, land use, vegetation type and dynamics, soil etc. • Dynamic Global Vegetation Models (DGVMS) • Use EO data to provide…. • Land cover • Estimates of “phenology” veg. dynamics (e.g. LAI) • Gross and net primary productivity (GPP/NPP)
EO and carbon cycle: current • Use global capability of MODIS, MISR, AVHRR, SPOT-VGT...etc. • Estimate vegetation cover (LAI) • Dynamics (phenology, land use change etc.) • Productivity (NPP) • Disturbance (fire, deforestation etc.) • Compare with models and measurements • AND/OR use to constrain/drive models