Download
1 / 47
480 likes | 736 Views
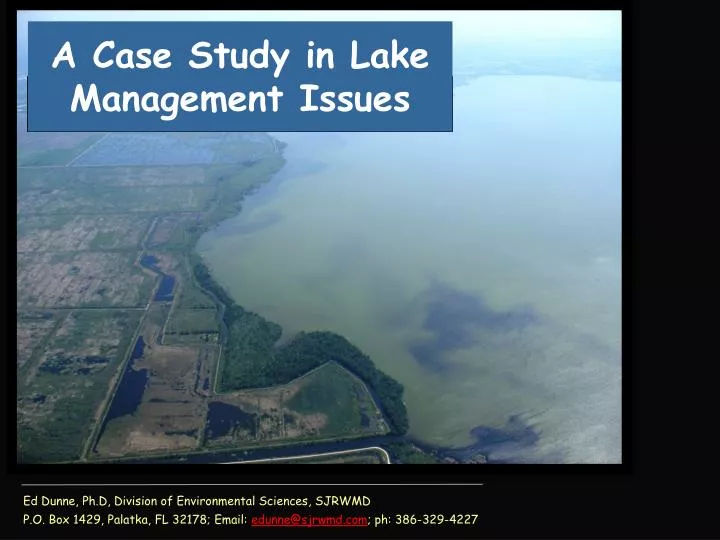
A Case Study in Lake Management Issues. Ed Dunne, Ph.D , Division of Environmental Sciences, SJRWMD P.O. Box 1429, Palatka, FL 32178; Email: edunne@sjrwmd.com ; ph: 386-329-4227. Overview. Issues in lake management Approach to lake restoration/enhancement Lake Apopka and historical sketch

E N D
A Case Study in Lake Management Issues Ed Dunne, Ph.D, Division of Environmental Sciences, SJRWMD P.O. Box 1429, Palatka, FL 32178; Email: edunne@sjrwmd.com; ph: 386-329-4227
Overview • Issues in lake management • Approach to lake restoration/enhancement • Lake Apopka and historical sketch • Time series of: • basin changes and nutrient loading • Nutrient budgets and water quality trends • Total P, Chla, Transparency, TSS • Management practices • Within watershed, within lake • Lake Improvements • Accessing lake data • Water levels and water quality
Florida 2010 Lakes, Reservoirs, and Ponds 2010 Source:http://iaspub.epa.gov/waters10/attains_state.control?p_state=FL#total_assessed_waters
Lakes, Reservoirs, and Ponds 2010:Causes of impairment Source: http://iaspub.epa.gov/waters10/attains_state.control?p_state=FL#total_assessed_waters
Multipronged approach to deal with impairment Restoration/Enhancement • Reduce nutrient load to the lake • Cost effective nutrient program to: • Remove • Reduce Source Control Within Watershed Mitigate Loss Within Lake
Controlling and Mitigating Eutrophication Improved Ecosystem Health Time
Multipronged approach to lake improvement Within Lake Within Watershed
Lake Apopka Historical timeline:1880s-2010s • 1880s Land around the lake $0.25/acre • 1890s Apopka Beauclair Canal • 1920s Sewage, wastewater, hurricanes (6-8ft) • 1940s Muck farms on NS, lake levee, hurricanes, blooms, < SAV • 1950s Water control structures on ABC • 1960s Fish kills, pesticide use by agriculture • 1970s State/federal restoration, bacterial disease, bass failing, 4 fish camps • 1980s Tower Chemical, fish kill, Apopka and SWIM Acts, no fish camps, pilot projects initiated, $15 million land purchase • 1990s FOLA, MFW pilot project, shad harvest, Act ’96 (P criterion), $100 million land purchase, bird die off • 2000s TMDL, MOU, MFW, reflooded 5,000 acres of NSRA • 2010s Bird list = 346 sp., MFW, shad, BMAP projects, reflooded 10,000 acres, > SAV
Basin Land Use Changes Sources: Lake Apopka External Nutrient Budget 1989-2002; Schelske et al., 2005.
Major Former Farm Areas Source: Lake Apopka External Nutrient Budget 1989-2010
Basin Land Use Changes Source: Lake Apopka External Nutrient Budget 1989-2010
Phosphorus Loading to Lake Apopka 1900-2002 Measured Estimated from literature Loading g m-2 yr-1
Some management practices to help improve the lakeWithin lakeWithin watershed
RefloodingAg. lands back to Wetlands • Phased Approach • Environmental Site Assessments, Risk Assessment • BA, BO, biota monitoring during flooding • Prior to flooding: • Field prep., which included soil amendment (3,000 ha; $2.5 m) • Remediation to reduce OCP - deep ploughing (1,620 ha; $9.6 m) • RESULTS • 2000 Initial flooding of Duda Sub-East 680 acres • 2011 Flooding to date about 10,000 acres
Phased Approach to Flooding 2000 Maps produced by P. Bowen
Phased Approach to Flooding 2005 Maps produced by P. Bowen
Phased Approach to Flooding 2010 Maps produced by P. Bowen
Phased Approach to Flooding 2011 9,870 acres flooded Maps produced by P. Bowen
Gizzard Shad Harvest on Lake Apopka 1993 - 2010 • GOALS • Remove P in fish bodies • Reduce recycling of P caused by bottom feeding • Reduce turbidity caused by bottom disturbance • RESULTS • 450-500 mT/yr of fish harvested • P removal in fish = 2-3 mT/yr
Marsh Flow-way 2003 - 2010 • GOALS • Maximize P removal from the lake • Provide wetland habitat • REMOVAL RESULTS • TP: 2 mT, 28%, 0.8 g m-2 yr-1 • TSS: 4,000 mT, 91%, 1,300 g m-2 yr-1 • TN: 80 mT, 22%, 26 g m-2 yr-1
Total Phosphorus (P) (mg/L) Post Pre Pre = period used to measure baseline loading for TMDL development (Magley, 2003) Post = period to include years with both normal and low lake stages
Changes in areal coverage of Vallisneriaamericanaalong Lake Apopka shoreline
Accessing lake data http://floridaswater.com/