Download
1 / 23
230 likes | 275 Views
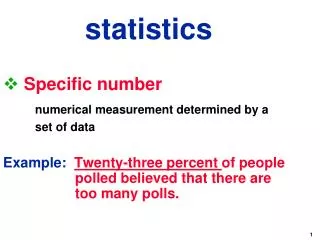
Specific number numerical measurement determined by a set of data Example: Twenty-three percent of people polled believed that there are too many polls. statistics. Method of analysis

E N D
Specific number numerical measurement determined by a set of data Example: Twenty-three percent of people polled believed that there are too many polls. statistics
Method of analysis a collection of methods for planning experiments, obtaining data, and then then organizing, summarizing, presenting, analyzing, interpreting, and drawing conclusions based on the data Statistics
Population the complete collection of all elements (scores, people, measurements, and so on) to be studied. The collection is complete in the sense that it includes all subjects to be studied. Definitions
Census the collection of data from every element in a population Sample a subcollection of elements drawn from a population Definitions
Parameter a numerical measurement describing some characteristic of a population Definitions population parameter
sample statistic Definitions • Statistic • a numerical measurement describing some characteristic of a sample
Definitions • Quantitative data • numbers representing counts or measurements • Qualitative (or categorical or attribute) data • can be separated into different categories that are distinguished by some nonnumeric characteristics
Definitions • Quantitative data • the incomes of college graduates • Qualitative (or categorical or attribute) data • the genders (male/female) of college graduates
Discrete data result when the number of possible values is either a finite number or a ‘countable’ number of possible values 0, 1, 2, 3, . . . Continuous (numerical) data result from infinitely many possible values that correspond to some continuous scale that covers a range of values without gaps, interruptions, or jumps Definitions 2 3
Discrete The number of eggs that hens lay; for example, 3 eggs a day. Continuous The amounts of milk that cows produce; for example, 2.343115 gallons a day. Definitions
nominal level of measurement characterized by data that consist of names, labels, or categories only. The data cannot be arranged in an ordering scheme (such as low to high) Example: survey responses yes, no, undecided, zip codes, color of an M&M Definitions
ordinal level of measurement involves data that may be arranged in some order, but differences between data values either cannot be determined or are meaningless Example: Course grades A, B, C, D, or F, Military Rank Definitions
interval level of measurement like the ordinal level, with the additional property that the difference between any two data values is meaningful. However, there is no natural zero starting point (where none of the quantity is present) Example: CalendarYears, Temperature Definitions
ratio level of measurement the interval level modified to include the natural zero starting point (where zero indicates that none of the quantity is present). For values at this level, differences and ratios are meaningful. Example: Height, Weight, Number of Credits Definitions
Nominal- categories only Ordinal- categories with some order Interval- differences but no natural starting point Ratio- differences and a natural starting point Levels of Measurement
Random Systematic Convenience Stratified Cluster Methods of Sampling
Definitions • Random Sample • members of the population are selected in such a way that each has an equal chance of being selected • Simple Random Sample (of size n) • subjects selected in such a way that every possible sample of size n has the same chance of being chosen
Random Sampling - selection so that each has an equalchance of being selected
Systematic Sampling - Select some starting point and then select every K th element in the population
Stratified Sampling - subdivide the population into subgroups that share the same characteristic, then draw a sample from each stratum
Cluster Sampling - divide the population into sections (or clusters); randomly select some of those clusters; choose all members from selected clusters
Convenience Sampling - use results that are readily available Hey! Do you believe in the death penalty?
Sampling Error the difference between a sample result and the true population result; such an error results from chance sample fluctuations. Nonsampling Error sample data that are incorrectly collected, recorded, or analyzed (such as by selecting a biased sample, using a defective instrument, or copying the data incorrectly). Definitions