Download
1 / 27
270 likes | 454 Views
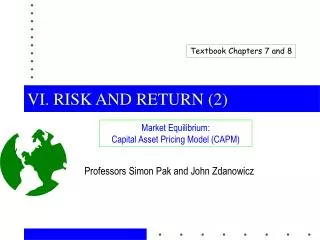
Textbook Chapters 7 and 8. VI. RISK AND RETURN (2). Market Equilibrium: Capital Asset Pricing Model (CAPM). Professors Simon Pak and John Zdanowicz. Outline. 1. What is the CAPM? 2. Results at Equilibrium 3. Capital Market Line (CML)

E N D
Textbook Chapters 7 and 8 VI. RISK AND RETURN (2) Market Equilibrium: Capital Asset Pricing Model (CAPM) Professors Simon Pak and John Zdanowicz
Outline • 1. What is the CAPM? • 2. Results at Equilibrium • 3. Capital Market Line (CML) • Example: Portfolio with Market portfolio and Riskless Asset • Conclusion on CML • 4. Security Market Line • Security Market Line in Beta form • SML - What does it mean? • Example 1: SML Application - Expected Return • Example 2: SML Application - Portfolio Beta • 5. Market Model: • Market Risk vs Non-Market Risk • Market Model and Diversification: Non-market risks are not rewarded • Example of Risk calculation • 6. Summary of CAPM • 7. Market Imperfections
1. What is the CAPM? • Capital Asset Pricing Model (CAPM): A theory trying to explain the following two questions: • What is the RELATIONSHIP between Expected Return and Risk of an Efficient Portfolioin equilibrium? - - - Capital Market Line • What is the RELATIONSHIP between Expected Return and Risk of Any Securityin equilibrium? - - - Security Market Line
1a. Assumptions in CAPM • Assumptions in CAPM • Each investor acts on the basis of PREDICTION about the future performances of securities, i.e., predictions stated in terms of ER, sR2, and r or Covariance • Each investor selects portfolio based on the MEAN-VARIANCE model: Max U(E,s) on the efficient frontier • Each can borrow or lend at the RISK-FREE RATE • borrowing rate = lending rate • rate is same for all investors • HOMOGENEOUS EXPECTATION: Each investor faces the same predictions about each and all securities
Expected Return M Efficient Frontier RF RISK 2. Results at Equilibrium 1. Same Efficient Frontier for ALL investors [homogeneous expectation] • Efficient Frontier : same for all investors • Given the efficient frontier of risky assets AND the riskless asset, the new efficient frontier is on the line from RFtangent to the efficient frontier of the risky assets • M : Optimal combination of Risky securities • RF : Same for all by assumption
2a. Results at Equilibrium - continued 2. At equilibrium, • the optimal combination of risky securities for each investor, M, must include ALL securities • the proportion of each security in M for each investor must equal its proportional value in the market as a whole If M for one investor has 10% of his/her portfolio in the IBM stocks and if total market value of the IBM stocks is 1% of the stock market, then the market can not be in equilibrium because M is same for all investors. This means there is an excess demand for IBM, 10%, vs 1% in supply.
Investor 2 Expected Return Investor 1 B M Efficient Frontier A RF RISK 2b. Results at Equilibrium - continued 3. At equilibrium, each individual investor chooses a portfolio consisting: • the Market Portfolio, M • the Riskless security (borrowing or lending at the riskless rate). • The investor may borrow or lend at the riskless rate depending upon the preference of the investor, the indifference curve regarding risk and return • At equilibrium, the total borrowing by all borrowers = the total lending by all lenders. • Investor 1 chooses a portfolio A, consisting of riskless asset (lending) and risky asset, M • Investor 2 chooses a portfolio B, consisting of riskless liability (borrowing) and risky asset, M. He invest all his money and more (borrowing) in M : More risk and higher expected return than M: Leveraged portfolio
Expected Return,EP Capital Market Line M EM EM - RF Slope of CML: RF sM sM Risk sP 3. Capital Market Line (CML) • Capital Market Line: the relationship between the EXPECTED RETURN(EP) and the RISK(sP) of an efficient portfolio at equilibrium • Vertical Intercept, RF : the risk-free rate • Slope of the CML , , trade -off between expected return, EP,and Risk sP , Market price of risk (reduction) • All efficient portfolios should be on the CML
Expected Return,EP CML B M EM A EA RF sA sM Risk sP 3a. Capital Market Line (CML) - continued • $100,000 Portfolio, A, has $60,000 in M and $40,000 in Risk-free asset. • What is the risk of the portfolio? sA = 0.6sM • What is the expected return of the portfolio? EA = 0.4RF + 0.6EM • Do EA and sA satisfy the CML equation? Yes From CML: EA = RF + (EM - RF) sA / sM = RF + (EM - RF) 0.6 = 0.4RF + 0.6EM : Same expression for EA Price of Risk sP
3b. Example: Portfolio with Market portfolio and Riskless Asset: Use CML to calculate EP and sP EXAMPLE: The S&P 500 index has an expected return of 15% and the risk is estimated at 20% . The one year US Treasury bill rate is 5% . If we assume the S&P 500 index is the market portfolio, what are the expected return and the risk of a portfolio with 20% of its value in the risk-free asset and 80% in the market portfolio? ANS: Use CML to calculate EP and sP : The expected return of the portfolio: EA = 0.2RF + 0.8EM=0.2 x 0.05 + 0.8 x 0.15 = 0.13 (=13%) The risk of the portfolio: sA = 0.8sM = 0.8 x 0.2 = 0.16 (=16%) Do EA and sA satisfy the CML equation? : Yes CML: EP = RF + (EM - RF)sP / sM = 0.05 + (0.15 - 0.05) sP / 0.2 EP = 0.05 + 0.5 sP EP = 0.13 and sP = 0.16 for the portfolio satisfy the CML equation.
Expected Return,EP CML B M EM A EA RF sA sM Risk sP 3c. Portfolio with Market portfolio and Riskless Debt:Leveraged Portfolio • $100,000 portfolio, B, has $150,000 in M and $50,000 in debt at risk-free rate. • What is the risk of the portfolio? sB = 1.5sM • What is the expected return of the portfolio? EB = - 0.5RF + 1.5EM • Do EA and sA satisfy the CML equation? Yes From CML: EB = RF + (EM - RF) sB / sM = RF + (EM - RF) 1.5 = - 0.5RF + 1.5EM Same expression for EB as before!
3d. Example: Portfolio with Market portfolio and Riskless Debt EXAMPLE - Leveraged Portfolio: The S&P 500 index has an expected return of 15% and the risk is estimated at 20% . The one year US Treasury bill rate is 5% . If we assume the S&P 500 index is the market portfolio, what are the expected return and the risk of a portfolio with 20% of its value in debt at the risk-free rate and 120% of its value in the market portfolio? ANS: The expected return of the portfolio: EA = - 0.2RF + 1.2EM= - 0.2 x 0.05 + 1.2 x 0.15 = 0.17 (=17 %): higher than EM because of the leverage The risk of the portfolio sA = 1.2sM = 1.2 x 0.2 = 0.24 (= 24%): higher risk than Market portfolio Do EA and sA satisfy the CML equation? Yes CML: EP = RF + (EM - RF)sP / sM = 0.05 + (0.15 - 0.05) sP / 0.2 --> EP = 0.05 + 0.5 sP EP = 0.17 and sP = 0.24 for the portfolio satisfy the CML equation.
3e. Conclusion on CML • Capital Market Line: the relationship between the EXPECTED RETURN(EP) and the RISK(sP) of an efficient portfolio at equilibrium • For a portfolio with X portion of its value invested in the market portfolio and (1-x) in risk-free asset, the portfolio risk and return are: • If X>1, then the portfolio consists of the market portfolio partially financed by borrowing at riskless rate (Leveraged Portfolio).
Expected Return,Ei SML in terms of Covariance Ei Sec i M Note it is not sM as in CML, but sM2 RF sM2 Cim Risk Covim 4. Security Market Line • Security Market Line: the relationship between the EXPECTED RETURN (Ei) and the RISK (Cov(i,m) or rim si, not just si) of any security at equilibrium See Appendix for Proof EM
Expected Return,Ei SML in terms of BETA Ei Sec i M EM RF bM=1 bi Risk bi 4a. Security Market Line in Beta form • Security Market Line: the relationship between the EXPECTED RETURN (Ei) and the RISK(binot Cov(i,m), rim si, si) of any security at equilibrium Most Useful Forms of Equation The excess return = the risk premium Beta, bi, is called VOLATILITY of security i The slope of the SML, (EM-RF), is “Market Risk Premium”
4b. SML - What does it mean? • The SML • true for any security or combination of securities, efficient or not. • The slope of the SML is the market price of risk (risk reduction), INCREMENTAL EXPECTED RETURN per UNIT OF RISK if the risk is measured in COVARIANCE of the security with the market portfolio if the risk is measured in BETA (bi) of the security • Beta for a portfolio = a weighted average of betas of all the securities included where the weight is the proportional value of the corresponding security in the portfolio [see appendix for proof]
4c. Example 1: SML Application • Market Risk (Beta) For Common Stocks:1989 - 1994 StockBetaStockBeta AT&T 0.92. Exxon .51 Biogen 2.20 Ford Motor Co. 1.12 Bristol Myers Squib .97 General Electric 1.22 Compaq 1.18 Microsoft 1.23 • Example 1: (Calculate the expected return using beta) What is the expected return for Exxon? For Microsoft ? Assume the risk free rate is 4.5% and the expected return of the market portfolio 12.7 % . ANS:The market risk premium = EM - RF = 0.127 - 0.045 = 0.082 (8.2%) EEXXON = rF + bEXXON(EM - RF) = 0.045 + 0.51 x 0.082 = 0.08682 (8.682%) EMICROSOFT = rF + bMICROSOFT(EM - RF) = 0.045 + 1.23 x 0.082 = 0.14586 (14.586%)
4d. Example 2: SML Application • Example 2: (Calculate Portfolio Beta) If a portfolio has $10,000 invested in Exxon and $20,000 in Microsoft, what is the portfolio beta? The expected return of the portfolio? Assume the risk free rate is 4.5% and the expected return of the market portfolio 12.7 % . ANS: bEXXON =0.51 and bMiCROSOFT =1.23 from the beta table Proportion invested in Exxon: xEXXON = 10,000/30,000 = 1/3 Proportion invested in MicroSoft: xMICROSOFT = 20,000/30,000 = 2/3 Therefore, bPORTFOLIO =xEXXONbEXXON + xMICROSOFTbMiCROSOFT = (1/3)x0.51 + (2/3)x 1.23 = 0.99 EPORTFOLIO = rF + bPORTFOLIO(EM - RF) = 0.045 + 0.99 x (0.127 - 0.045) = 0.1262 (12.62% ) Alternative method to calculate the expected return of the portfolio: EPORTFOLIO = xEXXON EEXXON + xMICROSOFT EMiCROSOFT = (1/3)x0.08682 + (2/3)x0.14586 =0.1262 (12.62% )
5. Market Model • SML - Expression uses the EXPECTED RETURNS ( Ei, EM) • Using Actual Returns - Random variable: • The true market portfolio should includes ALL INVESTMENT ASSETS including all securities, domestic and foreign, and all real estate investments. • In practice, various substitutes are used because the true market portfolio is not observable. • S&P 500 Index • NYSE Index • When a substitute portfolio, RI , is used in the expression of a security return, the equation is called a Market Model • This enables us to estimate BETA and ALPHA using the regression technique. The estimated beta is:
5a. Market Risk vs Non-Market Risk: • In a market model, the excess return on a security can be thought of as the sum of two components: • Market component of excess return and • Non-market component of excess return • The excess return for the security i has two sources of uncertainties or risks: • Market risk stemming from the uncertainties in RM • Non-market risk stemming from the company specific uncertainties, uncorrelated to the market risk By taking variances of the above equation we obtain: Total Risk = Market Risk + Non-market Risk
5b. Diversification: Non-market risks are not rewarded • When a security is appropriately valued, i.e., in equilibrium: • There is no reward for taking the non-market risk • Portfolio Diversification • When a portfolio is composed of many different securities, the portfolio risk can be expressed as (see the note for proof): TotalRiskPortfolio = MarketRiskPortfolio + Non-marketRiskPortfolio
5c. Conclusion: Market Model • The excess return on a security is the sum of two components: • Market component of excess return and • Non-market component of excess return • Stand alone risk (total risk) of a security’s excess return: • Market risk, systematic risk, non-diversifiable risk • Non-market, unique, unsystematic, diversifiable risk • Non-market risk is not rewarded because it can be diversified away • Portfolio Diversification TotalRiskPortfolio = MarketRiskPortfolio + Non-marketRiskPortfolio
5d. Example of Risk Calculation • Suppose XYZ security’s beta is 1.5 and the market portfolio has an expected return of 17% with the standard deviation of 20%. Assume the risk free rate is 5%. 1. What is the expected return of the XYZ security? 2. What is the systematic risk of the security return? 3. If the total risk of the security is 45%, what is the non-market risk? • ANS: 1. USE SML: Ei = 5 + 1.5 x (17-5) = 23% 2. SystmaticRisk: sis= bi sM = 1.5 x 0.2 = 0.3 (=30%) 3. Total risk: Recall (TotalRisk)2 = (SystematicRisk)2 + (NonMarketRisk)2 Therefore: (0.45)2 = (0.3)2 + (NonMarketRisk)2 Solving for (NonMarketRisk)2 = 0.1125 Taking the square root of both sides of the expression: NonMarketRisk = SQRT (0.1125) = 0.3354 (=33.54%)
6. Summary of CAPM Results • All efficient portfolios are on CML, i.e. EP and sP • All securities are on SML, i.e. Ei and bi, Cov(i,m), or rim si • A security’s expected return does not necessarily increase with its total (stand alone) risk. It increases with its systematic risk! • An efficient portfolio, fully diversified portfolio, has no unsystematic risk • Systematic risk is the only source of uncertainty in the rate of return on the efficient portfolio • The beta, volatility, of a portfolio is a weighted average of individual security betas. The weight is the proportion of the security value in the portfolio. • In an efficient market (CAPM world), • systematic risk is rewarded by bi(EM - RF) • unsystematic risk is not rewarded.
EP CMLL CMLB ML EP MB M2 RFL M1 RFB RF Risk sP Risk sP 7. Market Imperfections • Different Lending and Borrowing Rates • CAPM breaks down • IF Borrowing and Lending rates are close then MB and ML should be very similar. • Heterogeneous belief: • Different individual has different combination of risky securities. • Equilibrium will be achieved when Demand = Supply of securities • Not much else can be said • Inefficient Market: • Securities may be underpriced or overpriced. • Portfolio performance measurement is meaningful Ei X: underpriced SML RF X :overpriced Risk b i
Appendix 1. Security Market Line • Security Market Line: the relationship between the EXPECTED RETURN (Ei) and the RISK(si) of any security at equilibrium Expected Return M The efficient frontier of a portfolio composed of M and Sec i should have a slope at M equal to the slope of the CML. Therefore: EM Ei Sec i RF sisM RISK
Appendix 2: Portfolio Beta=Weighted Average of Security Beta’s Suppose a portfolio has two securities in proportion x1 for security 1 and x2 for security 2. Then the portfolio return: EP = x1E1+ x2E2 Since E1 =RF + b1(EM-RF) and E2=RF + b2(EM-RF) we get: EP = x1 [RF + b1(EM-RF)]+ x2 [RF + b2(EM-RF)] = (x1+x2)RF + [x1 b1 + x2 b2 ](EM-RF) = RF + bP (EM-RF) where bP = x1 b1 + x2 b2 : weighted average of individual security beta’s