Download
1 / 26
260 likes | 389 Views
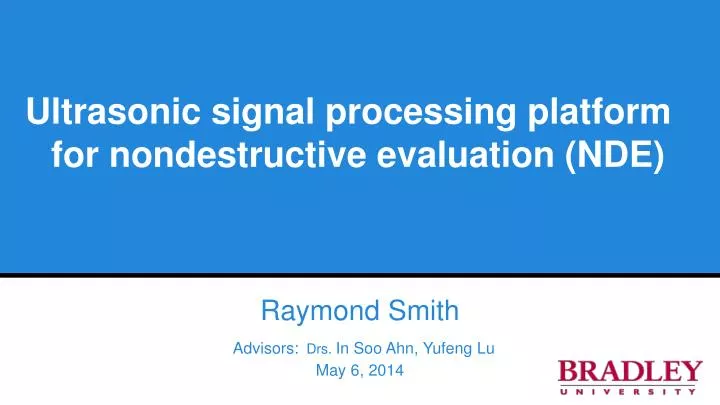
Ultrasonic signal processing platform for nondestructive evaluation (NDE). Raymond Smith A dvisors: Drs. In Soo Ahn , Yufeng Lu May 6, 2014. Outline. Motivation System and Block Diagrams Design Results Conclusions. 2. Motivation. Ultrasonic Platform:

E N D
Ultrasonic signal processing platform for nondestructive evaluation (NDE) Raymond Smith Advisors: Drs. In SooAhn,Yufeng Lu May 6, 2014
Outline • Motivation • System and Block Diagrams • Design Results • Conclusions 2
Motivation • Ultrasonic Platform: • Requires hardware adaptability • Demands high speed performance • Handles versatile signal processing • techniques 3
Goals • Design an ultrasonic signal processing • platform with high speed data acquisition • Implement the embedded system on a Field • Programmable Gate Array(FPGA) • Complete design modules for hardware and • software for design extension 4
Design and Block Diagrams • System block diagram • Equipment and specifications • Design flow 5
System block diagram Touchscreen device Touchscreen controller Embedded System on FPGA Analog-to-Digital Converter ADC controller Analog Output FPGA Board DAC controller Ultrasonic flaw detector Oscilloscope Digital-to-Analog converter Daughter Board Figure 1 System block diagram 6
Equipment and Specifications FPGA Board ( Virtex5) Embedded system with MicroBlazeprocessor 32-bit scalable and user-configurable microprocessor: Area-optimized, Speed-optimized, Power-optimized or performance-balance option. 7
Equipment and Specifications • 12 Bit analog-to-digital converter • MAX1213N (Up to 170 MSPS) • LVDS data port (low-voltage differential signaling) Figure 2 MAX1213N block diagram[1] 8
Equipment and Specifications • 14 Bit digital-to-analog converter • MAX5874 • Up to 200 MSPS Figure 3 MAX5874 block diagram [1] 9
Figure 4 System Setup MAX1536 DC/DC converter 3.3 V1.8 V 10
LCD touch screen • 4.3” 480 x 272 capacitive touch screen • Serial communications • Displays data • Ultrasonic flaw detector • Provides analog signal • Reference for testing • Standalone system 11
Design flows Figure 5 Hardware/Software co-design on MicroBlaze [5] 12
I-Cache BRAM Microblaze-based embedded system on FPGA[3] Local Memory Bus MicroBlaze 32-Bit RISC Core BRAM Figure 6 Embedded system on MicroBlaze[3] D-Cache BRAM Fast Simplex Link PLB PLB Bus Bridge Processor Local Bus Processor Local Bus Arbiter Arbiter 0,1….15 Custom Functions Custom Functions On-Chip Peripheral UART GPIO D/A Controller A/D Controller CacheLink Touch Screen Daughter boards SDRAM 13
Results • Digital to Analog Converter (VHDL, Peripheral) • Analog to Digital Converter (VHDL, Peripheral) • Touchscreen Display (C language) • Signal Processing Algorithm (C language) 14
Digital to Analog Converter Figure 6 Sawtooth Test Figure 7 Experimental ultrasonic data 15
Analog to Digital Converter Figure 8 ADC interface diagram 16
Figure 10 Loopback test Figure 9 Differential clock outputs 17
Touchscreen display design • GEMstudio was used for display design • Communicate with FPGA through UART (Baud rate: 115200) • C language Figure 12 Sawtooth test Figure 13 Ultrasonic signal display 19
Algorithm example split spectrum processing (SSP) Inverse FFT f 1 Inverse FFT Target Detection results Detection FFT f 2 Post-Processing: Experimental data Figure 14 SSP block diagrams[7] Inverse FFT 20 fn
SSP Results Figure 16 Signals in different frequency bands Figure 15 Experimental ultrasonic data 21
Figure 17 detection results (MATLAB) Figure 18 detection results (C language) 22
Conclusions • An ultrasonic signal processing system has been • developed for nondestructive evaluation. • ADC and DAC devices have been interfaced with an • FPGA • A touchscreen board has been interfaced • with an embedded system running on a FPGA. • It can be used as a platform for projects in • communication and signal processing 24
Resources • [1] MAXIM integrated, “MAX1213N/MAX1214N Evaluation Kits” MAX1213N • datasheet, 2006. • [2] MAXIM integrated, “MAX5873/MAX5874/MAX5875 Evaluation Kits” • MAX5874 datasheet, 2006. • [3] Xilinx EDK 14.5 design guide and workshop, Xilinx 2014. • [4] XILINX “ML505/ML506/ML507 Evaluation Platform: User Guide” • XC5VLX110T datasheet, Nov. 2006. • [5] Amulet Technologies, “User guide,” STK480272C datasheet, 2013. • [6] Xilinx (2011, April 13). EDK Concepts, Tools, and Techniques Available: • http://www.xilinx.com/support/documentation/sw_manuals/xilinx13_1/edk_ctt.pdf • [7] J. Saniie,, “System-on-Chip Design for Ultrasonic • Target Detection Using Split-Spectrum Processing and Neural Networks,” • IEEE Trans. Ultrasonics..., vol. 58, no.7, pp. 1354-1368, July, 2011 25
Questions? Thank you 26