Download
1 / 18
180 likes | 254 Views
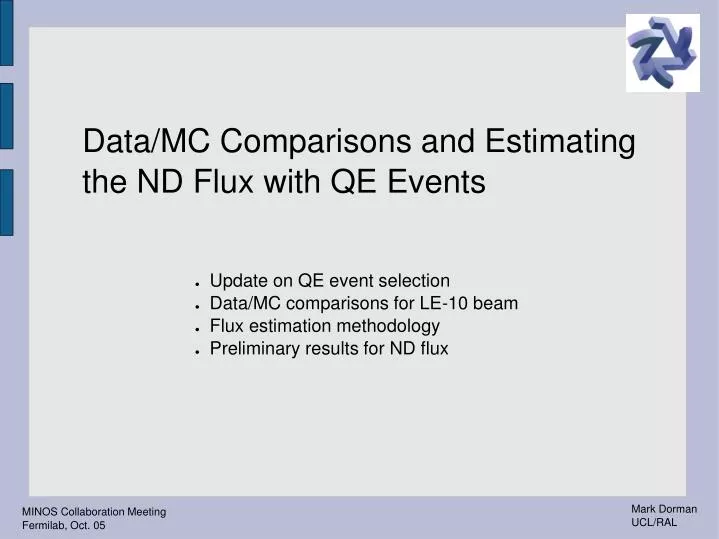
Data/MC Comparisons and Estimating the ND Flux with QE Events. Update on QE event selection Data/MC comparisons for LE-10 beam Flux estimation methodology Preliminary results for ND flux. Update on QE Event Selection.

E N D
Data/MC Comparisons and Estimating the ND Flux with QE Events • Update on QE event selection • Data/MC comparisons for LE-10 beam • Flux estimation methodology • Preliminary results for ND flux
Update on QE Event Selection • I have switched to grouping my background PDFs (RES,DIS,NC) into a single PDF in each variable and bin of energy so as to have larger numbers of events and avoid any complicated normalizations. • The PDFs now look as in the following examples: 2.0 – 2.5 GeV
Update on QE Event Selection • I have switched to grouping my background PDFs (RES,DIS,NC) into a single PDF in each variable and bin of energy so as to have larger numbers of events and avoid any complicated normalizations. • The PDFs now look as in the following examples: 6.0 – 7.0 GeV
Update on QE Event Selection • I have switched to grouping my background PDFs (RES,DIS,NC) into a single PDF in each variable and bin of energy so as to have larger numbers of events and avoid any complicated normalizations. • The PDFs now look as in the following examples: 10 – 12 GeV
Update on QE Event Selection • I have switched to grouping my background PDFs (RES,DIS,NC) into a single PDF in each variable and bin of energy so as to have larger numbers of events and avoid any complicated normalizations. • The PDFs now look as in the following examples: 14 – 17 GeV
Data and MC Files Used • I have been working with R1.18 processed data and MC for the LE-10 beam and R1.18 processed 1/E flux MC. • PDFs for the analysis were trained on a subset of the 1/E flux MC and the cuts to select QE-like events for each bin of energy were determined from a different subset of the 1/E flux MC. • The data/MC comparisons and flux estimation have been performed using a large fraction of the LE-10 MC files available and LE-10 data (excluded runs where the beam config. variable was 0). • Using standard beam quality cuts the POTs for data and MC were: • Just under 15 times as much data as MC. All data/MC comparison plots have been normalized to the POTs of the MC. MC – 98188 snarls x 2.4e13 POTs/snarl ~ 2.4e18 POTs Data – (used TORTGT) ~ 3.4e19 POTs
Efficiencies and Purities of QE-like Sample Selection removes: ~60% QE events ~91% RES events ~97% DIS events ~98% NC events
Data/MC Comparisons – Neutrino Energy Spectra • MC is shifted to the right relative to data. • Agreement good though.
Data/MC Comparisons – Other Energy Spectra • Shift still visible in muon and shower energies.
Data/MC Comparisons – Assumed QE Events • Black histogram is data events with energy reconstructed assuming the event is QE. • Black points are data events with energies reconstructed as usual. • Likewise for red MC histogram and points. • Data and MC agree fairly well and also the neutrino energy spectra reconstructed with the assumption of a QE event agree well with the regularly reconstructed energies in both data and MC. • This is what would be expected of a reasonably pure QE-like sample.
Data/MC Comparisons – q^2 Distributions • Agree well.
Data/MC Comparisons – Low q^2 Suppression? MC is higher in the 0-200 MeV region but the effect is not pronounced. I tried using a different QE selection that increased the QE purity in the few GeV region. I see a more pronounced effect in this sample.
Data/MC Comparisons – y Distributions • Again the agreement is fairly good. • Slight excess of y=0 events in MC.
Flux Estimation Methodology • For a given energy bin i: number of QE-like events = flux * ( QE xsec*QE efficiency + BG xsec*BG efficiency) = RES xsec*RES efficiency + DIS xsec*DIS efficiency + NC xsec*NC efficiency From Neugen: • Get efficiencies from MC. • Can't use NC xsec so use MC to estimate number of NC background events and subtract off.
Flux Estimate • The following is then an estimate of the shape of the flux: • Next want to normalize to a MC flux based on the total cross section in the 10-20 GeV region to put an absolute scale on this plot.
Further Work • There are some issues that need to be resolved... • Am going to normalize my flux to a Gnumi flux that was produced using true neutrino energies and so must take account of events moving into different reconstructed neutrino energy bins (energy resolution for my events ~20%). • Cannot completely decouple the NC background subtraction from the flux itself and this causes problems in the low energy bins where the NC events occupy a larger fraction of the total events in the sample. Need to redo the analysis with a harder cut to get the QE purity up and the background contributions down. • Need more LE-10 MC to reduce the errors that come from estimating my QE, RES and DIS efficiencies/inefficiencies.