Download
1 / 24
260 likes | 470 Views
The Stratified Ocean and the Global Distribution of T-S. Lecture 3. OEAS-604. September 14, 2011. Outline: Light in the Ocean Impact of light on surface temperature The Mixed Layer Thermocline, Halocline and Pycnocline Global Distribution of Temperature and Salinity MATLAB Demo.

E N D
The Stratified Ocean and the Global Distribution of T-S Lecture 3 OEAS-604 September 14, 2011 • Outline: • Light in the Ocean • Impact of light on surface temperature • The Mixed Layer • Thermocline, Halocline and Pycnocline • Global Distribution of Temperature and Salinity • MATLAB Demo
Sunlight does not travel well in the ocean. Scattering and absorption weaken light: • Scattering occurs when light is bounced between air and water molecules, dust and other objects. • Absorption occurswhen light’s electromagnetic energy is converted to heat in the molecules of seawater. Long wavelengths are preferentially absorbed. Short wavelengths are preferentially scattered.
Light availability decreases exponentially with depth I = irradiance at any depth IO = irradiance at the surface k = light attenuation coefficient z = depth
Values of k will vary depending on water clarity (amount of sediment, phytoplankton, etc …) For very clear water k ~ 0.01 m-1 Chesapeake Bay k ~ 10 m-1 Aphotic zone is define as the depths beyond which less than 1% of sunlight penetrates
Quick Review of units: Irradiance is the density of solar radiation on any given surface Usually measured in Watts/m2 A Watt is the SI unit for power (amount of energy expended in a given time) 1 Watt = Joule/sec A Joule is the SI unit for energy 4.186 joules = 1 calorie A calorie is a measure of heat defined as: the amount of energy required to raise 1 gram of water 1 °C. Specific Heat of Water: The specific heat is the amount of heat per unit mass required to raise the temperature by one degree Celsius (4.186 J/gC°) Change in temperature Specific heat Heat added mass
Temperature Profiles in the Ocean Seasonal thermocline • The surface layers are heated in summer and cool in winter • Since the surface water is warmer than the water below, it is less dense and does not mix downward easily. • This results in a thermocline: A vertical temperature gradient, in some layer of a body of water, that is appreciably greater than the gradients above and below it. • The permanent thermocline refers to the thermocline not affected by the seasonal and diurnal changes in the surface forcing • The seasonal is established each year by heating of the surface water in the summer, and is destroyed the following winter by cooling at the surface and wind-driven mixing Permanent thermocline
Oceanic Mixed Layer • Wind blowing on the ocean stirs the upper layers leading to a thin mixed layer. • Mixed layer is roughly 50 – 200m • The depth and temperature of the mixed layer varies from day to day and from season to season in response to two processes: Heat fluxes through the surface heat and cool the surface waters. Changes in temperature change the density contrast between the mixed layer and deeper waters. The greater the contrast, the more work is needed to mix the layer downward and visa versa. Turbulence in the mixed layer mixes heat downward. The turbulence depends on the wind speed and on the intensity of breaking waves. Turbulence mixes water in the layer, and it mixes the water in the layer with water in the thermocline.
(from Pinet, 1998) Growth of the Seasonal Thermocline
(from Pinet, 1998) Decay of the Seasonal Thermocline
Surface cooling leads to “Convection” Surface cooling increases density of surface water. Surface water is no longer “stable” so it mixes downward due to buoyancy
Density gradients are not always controlled by Temperature Taken in Arctic Ocean
More generally, a region of strong density gradient is called a pycnocline. The rapid density increase in the pycnocline is mainly due to a decrease in temperature with depth in this area – the thermocline. However, in some regions, especially in shallow water near rivers, a pycnocline may develop in which the density increase with depth is due to vertical variations in salinity. In this case, the pycnocline is a halocline.
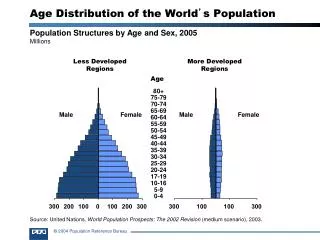
Equatorial regions have greater inputs of solar radiation than losses. Polar regions have loss more radiation than they absorb. But, both are generally in steady state (not rapidly warming or cooling) Why?
(from Pinet, 1998) • A typical cross-section along the ocean (from north to south) reveals the warmest waters located near the equator at a relatively thin layer. Most of the ocean features cold water < 4ºC. • A strong thermocline is usually found in tropical latitudes.
1. Water that evaporates from the oceans is transported by winds. • The Westerlies in the northern hemisphere transport a significant amount of moisture from the Atlantic that falls as precipitation in the Pacific. • It is estimated that this results in a net loss of 0.32 Sverdrups of water from the Atlantic to the Pacific. 1 Sverdrup = 106 m3 From Broecker (1997) But, both the volume and salinity of the Atlantic Ocean are basically constant. How can this be?
Why is Atlantic Saltier than Pacific? Loss of 0.32 Sv due to evaporation 1. The evaporative loss of water from the Atlantic is compensated by a net import of water from the Pacific. 2. The increase in salinity due to net evaporative loss is compensated by an exchange of more salty Atlantic waters for less salty Pacific waters
MATLAB Oceanographic Tools “The Seawater Toolbox” The seawater toolbox is a collection of “functions” that make various calculations of oceanographic relevant quantities (like density) STEP #1 Download seawater toolbox : http://www.cmar.csiro.au/datacentre/ext_docs/seawater.htm STEP #2 Put folder “seawater_ver3_2” somewhere on your computer STEP #3 In MATLAB go to File->setpath->add with subfolder->select location of folder STEP #4 save
All the functions in the seawater toolbox begin with the prefix “sw_” If you type “help sw_dens” MATLAB will give you information about how use this function. You provide salinity (S), temperature (T) and pressure (P) and sw_dens returns the value of density.
Simple program to ARGO CTD data and make a basic plot load ARGO_CTD.txt pressure=ARGO_CTD(:,1); temperature=ARGO_CTD(:,2); salinity=ARGO_CTD(:,3); density=sw_dens(salinity,temperature,pressure); figure(1);plot(density,-pressure) xlabel('density (kg/m^3)') ylabel('depth (m)')