Download
1 / 19
190 likes | 348 Views
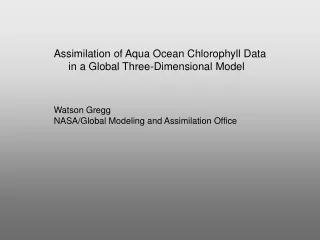
Ocean Biological Modeling and Assimilation of Ocean Color Data Watson Gregg NASA/GSFC/Global Modeling and Assimilation Office. Assimilation Objectives: Improved State and Flux Estimation (Chlorophyll and Primary Production) Modeling Objectives: New Derived Variables

E N D
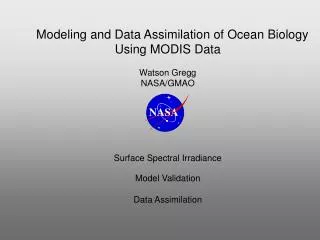
Ocean Biological Modeling and Assimilation of Ocean Color Data Watson Gregg NASA/GSFC/Global Modeling and Assimilation Office Assimilation Objectives: Improved State and Flux Estimation (Chlorophyll and Primary Production) Modeling Objectives: New Derived Variables Linkages Between Ocean and Atmosphere Improved Climate Predictions
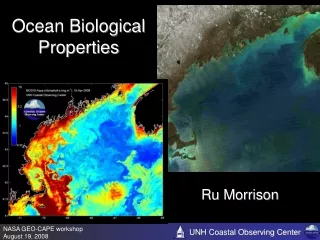
NASA Ocean Biogeochemical Model (NOBM) Chlorophyll,Phytoplankton Groups Primary Production Nutrients DOC, DIC, pCO2 Spectral Irradiance/Radiance Outputs: Winds, ozone, relative humidity,pressure, precip. water, clouds (cover, τc), aerosols (τa, ωa, asym) Dust (Fe) Sea Ice Winds SST Radiative Model (OASIM) Ed(λ) Es(λ) Ed(λ) Es(λ) IOP Layer Depths Biogeochemical Processes Model Circulation Model (Poseidon) Temperature, Layer Depths Advection-diffusion Global model grid: domain: 84S to 72N1.25 lon., 2/3 lat.14 layers
Biogeochemical Processes Model Ecosystem Component Nutrients Phytoplankton Si Diatoms Silica Detritus NO3 Chloro- phytes Herbivores NH4 Cyano- bacteria Fe Cocco- lithophores N/C Detritus Iron Detritus
Biogeochemical Processes Model Carbon Component pCO2 (air) Winds, Surface pressure pCO2 (water) Phyto- plankton Herbivores Dissolved Inorganic Carbon Dissolved Organic Carbon N/C Detritus
Ocean Color Assimilation: The SEIK filter (Lars Nerger, GMAO) Generally an ensemble Kalman filter Simplification • Keep state covariance matrix constant (store ensemble perturbations, integrate ensemble mean state) • essentially an ensemble OI scheme • Application to Ocean Color • Daily assimilation of gridded data into surface layer • Chlorophyll distribution log-normal • assimilate logarithmic quantities • Satellite errors can affect results • explicitly define regional satellite errors estimated from global analysis of in situ data
Comparison withIn-Situ Data • Spatially and temporally coincident data (daily) • Strong improvement compared to free-run model • Several regions: Assimilation with smaller error than SeaWiFS
Assimilation: Conclusions Major improvement of state estimates (chlorophyll) occasionally superior to SeaWiFS estimates Substantial improvement of flux estimates (primary production) but model still controlling Predictive capability on order of days New work on assimilation methods needed and ongoing
New Derived Variables: Phytoplankton Groups Blue = NOBM; Green = Data
Balch et al. (2005) Calcite Sep-Dec Balch et al. (2005) Calcite Apr-Jun Balch et al. (2005) Calcite Jul-Aug
Likely locations of coccolithophore blooms from Iglesias-Rodriguez et al., 2002)
NOBM Alvain et al. (2005) Jan Alvain et al. (2005) Apr Alvain et al. (2005) Jun Red = diatomsGreen/yellow = cyanobacteriaBlue = cocco (NOBM) haptophytes (Alvain)
New Derived Variables: Functional Groups Conclusions Model compares favorably with in situ data, but there are major discrepancies Comparison with satellite observations is sometimes encouraging: coccolithophores in North Atlantic with Balch and Brown diatoms with Kamykowski And sometimes disappointing: coccolithophores in North Pacific with Balch general patterns with Alvain Emerging field and convergence is fleeting, even with definition of groups (except diatoms)