Download
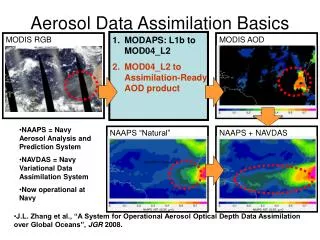
1 / 22
220 likes | 232 Views
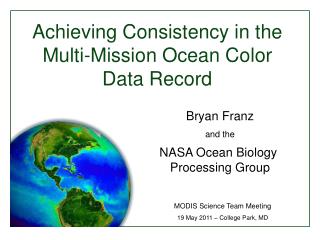
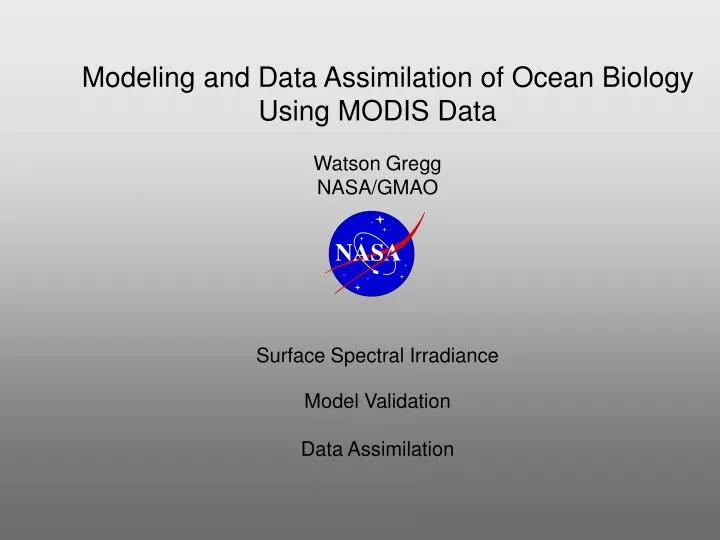
Modeling and Data Assimilation of Ocean Biology Using MODIS Data Watson Gregg NASA/GMAO Surface Spectral Irradiance Model Validation Data Assimilation. NASA Ocean Biogeochemical Model (NOBM). Chlorophyll, Phytoplankton Groups Primary Production Nutrients DOC, DIC, pCO 2

E N D
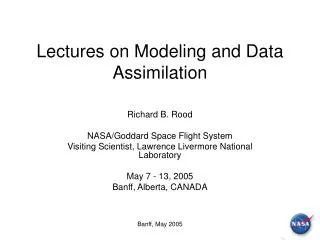
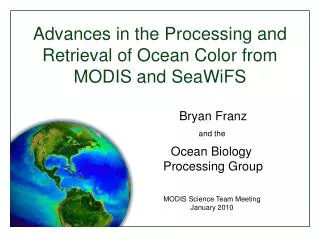
Modeling and Data Assimilation of Ocean Biology Using MODIS Data Watson Gregg NASA/GMAO Surface Spectral Irradiance Model Validation Data Assimilation
NASA Ocean Biogeochemical Model (NOBM) Chlorophyll,Phytoplankton Groups Primary Production Nutrients DOC, DIC, pCO2 Spectral Irradiance/Radiance Outputs: Winds, ozone, relative humidity, pressure, precip. water, clouds (cover, τc), aerosols (τa, ωa, asym) Dust (Fe) Sea Ice Winds SST Radiative Model (OASIM) Ed(λ) Es(λ) Ed(λ) Es(λ) IOP Layer Depths Biogeochemical Processes Model Circulation Model (Poseidon) Temperature, Layer Depths Advection-diffusion Global model grid: domain: 84S to 72N1.25 lon., 2/3 lat.14 layers
OASIM (Ocean-Atmosphere Spectral Irradiance Model) 33 spectral bands, 25 nm resolution 350-700nm CO2 Water vapor Ozone Oxygen Molecules, aerosols LwN Ed Ed, Es Es Ed Es Ed, Es air sea Eu (1 - ) Es (1 - ) Ed
Spectral absorption and scattering coefficients m-1 (water); m2 mg-1(others) Wavelength nm
Data sets needed for OASIM and dates available. ISCCP is the International Satellite Cloud Climatology Project; MODIS is the Moderate Resolution Imaging Spectroradiometer (Terra and Aqua are spacecraft); AVHRR is the Advanced Very High Resolution Radiometer; TOMS is the Total Ozone Mapping Spectrometer (Nimbus-7 and EP (Earth Probe) are spacecraft); and MERRA is the Modern-Era Retrospective analysis for Research and Applications . 1981 1983/06 1993/05 1996/07 2000/03 2002/07 Clouds CoverISCCP climatology ISCCP LWPISCCP climatology ISCCP reMODIS climatologyMODIS-TerraMODIS-Terra+Aqua Aerosols τaAVHRR MODIS-TerraMODIS-Terra+Aqua ωaMODIS climatologyMODIS-TerraMODIS-Terra+Aqua asymmetryMODIS climatologyMODIS-TerraMODIS-Terra+Aqua OzoneNimbus-7 TOMS Climatology EP-TOMS Sfc PressureMERRA Wind SpeedMERRA Rel. humidityMERRA Precip. waterMERRA
In situ observations of total surface irradiance. (>2000 observations)
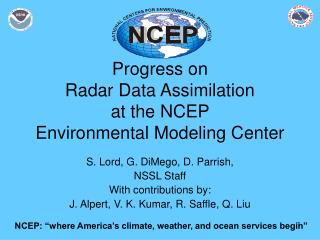
ISCCP OASIM N = 2249 Slope = 0.894 Y-int = 37.31 r = 0.932 RMS = 18.96 Bias = 12.69 N = 2322 Slope = 1.017 Y-int = 0.212 r = 0.888 RMS = 20.91 Bias = 4.19 NCEP ISLSCP II N = 2333 Slope = 0.604 Y-int = 99.61 r = 0.696 RMS = 29.78 Bias = 7.456 N = 270 Slope = 1.032 Y-int = 10.43 r = 0.969 RMS = 23.06 Bias = 17.66
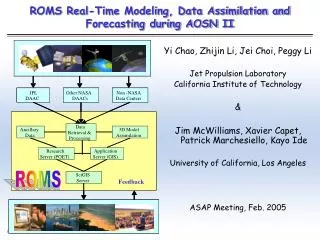
Model Validation Most common use of MODIS data How well does the model perform?
Seasonal Correlation North Pacific North Atlantic North Central Pacific North Central Atlantic North Indian Equatorial Indian Equatorial Pacific Equatorial Atlantic Chlorophyll (mg m-3) South Indian South Pacific South Atlantic Antarctic Day of Year Statistically positively correlated (P < 0.05) all 12 basins Red = model Diamonds = MODIS monthly mean
Data Assimilation Incorporation of data into a model via constant confrontation Now becoming established in ocean biology >50 papers using data, 12 using satellite data (Gregg et al., Journal of Marine Systems, 2009) In ocean biology, Two Classes: Variational (e.g., adjoint, 4DVar) Sequential (e.g., Kalman Filter) Here we used Sequential Methodologies, Conditional Relaxation Analysis Method Ensemble Kalman Filter
1 Data Assimilation: NASA Ocean Color Sensors (SeaWiFS and MODIS-Aqua) Assimilation variable: chlorophyll Conditional Relaxation Analysis Method (sequential method) Comparison with in situ data: Bias Uncertainty N SeaWiFS -1.3% 32.7% 2086 Assimilation Model 0.1% 33.4% 4465
Assimilation of Satellite Chlorophyll 1 mg m-3 Data assimilation improves a model by forcing agreement with data and reducing model biases. It also improves the data by filling in missing data and reducing sampling biases.
Daily ocean coverage by MODIS-Aqua and SeaWiFS. clouds aerosols sun glint inter-orbit gap sensor tilt change high solar zenith angle
MODIS Sampling Aug 2003 Assimilation Aug 2003 mg m-3 Difference (MODIS-assimilation) Aug 2003 No. Days Sampled by MODIS Aug 2003 Number %
Advection 350 375 400 425 450 475 525 550 500 575 625 600 700 650 675 Biology Optics aCDOM aCDM ad Phytoplankton TChl a bbp Chloro Diatoms Cyano Cocco Herbivores achl Silica Detritus Iron Detritus bw aw Nutrients Fe, NO3, NH4 Si Mixing pCO2atm pCO2sw PIC DIC DOC 443 N/C Detritus bPIC POC 443 bd bchl Carbon
Summary • MODIS data find multiple uses for ocean biology modeling, from radiative transfer to ocean modeling validation to data assimilation • MODIS atmospheric and ocean color data are useful for ocean biology modeling • Data assimilation not only improves models but also improves data representations