Download
1 / 27
270 likes | 274 Views
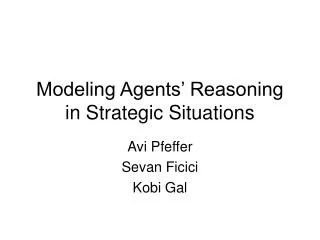
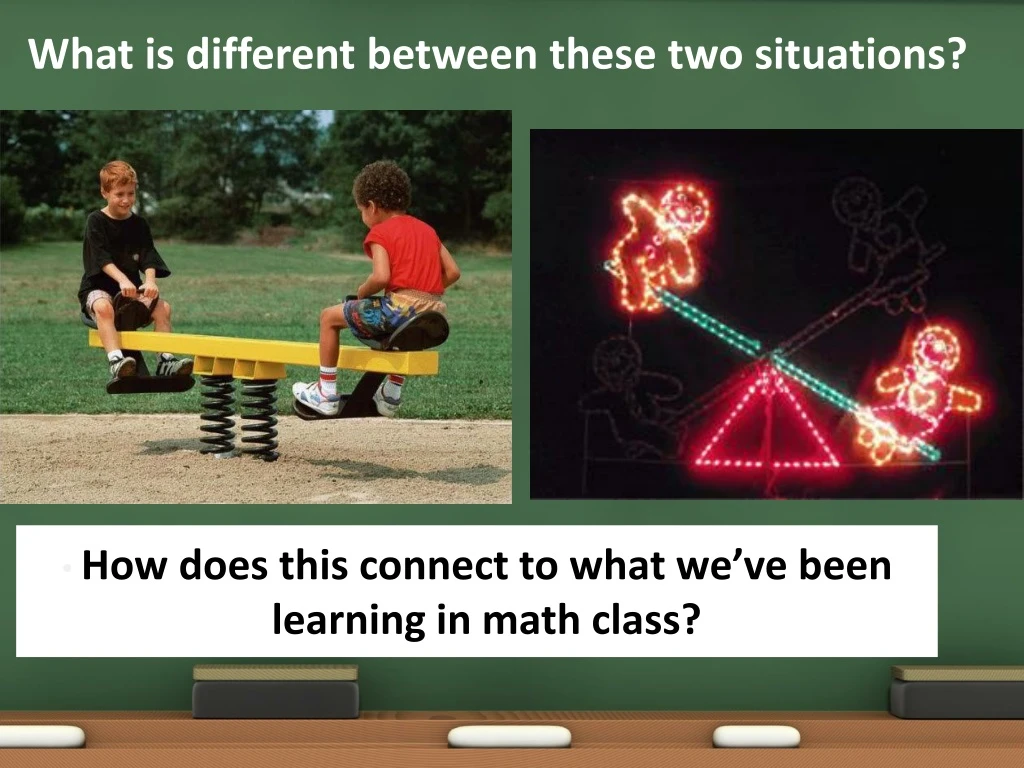
What is different between these two situations?. How does this connect to what we’ve been learning in math class?. <. >. <. <. Solving Inequalities. <. <. <. >. Learning Objectives for Today. Students will understand how inequalities are similar and different to equations.

E N D
What is different between these two situations? • How does this connect to what we’ve been learning in math class?
< > < < Solving Inequalities < < < >
Learning Objectives for Today • Students will understand how inequalities are similar and different to equations. • Students will be able to graph an inequality and write an inequality from a graph.
An inequality is similar to an equation, but instead of an equal sign (=) it has one of these signs: < : less than ≤ : less than or equal to > : greater than ≥ : greater than or equal to AND instead of having one number for an answer, you will have a set of numbers.
What does an inequality mean? • It is a mathematical sentence that uses one of the inequality symbols to state the relationship between two quantities.
What is my symbol? • At least 18 people were at the party. ≥ • The crowd was made up of no less than 80 people. ≤ • The Super Bowl is viewed by more than one billion viewers every year. >
What is my symbol? • You can take no more than 3 cookies the first time through the line. • You can have at most 11 people on your team. • Children under 6 eat FREE! • Must be over 40 inches tall to ride.
Graphing Inequalities • When we graph an inequality on a number line we use open and closed circles to represent the number. • (less than) (less than) (greater than) (less than or equal to) (greater than or equal to) Plot an open circle < < Plot a closed circle ≥ ≤
x < 5 means that whatever value x has, it must be less than 5. Give me 3 numbers that x could be.
-25 -20 -15 -10 -5 0 5 10 15 20 25 Numbers less than 5 are to the left of 5 on the number line. • If you said 4, 3, 2, 1, 0, -1, -2, -3, etc., you are right. • There are also numbers in between the integers, like 2.5, 1/2, -7.9, etc. • The number 5 would not be a correct answer, though, because 5 is not less than 5.
x ≥ -2 means that whatever value x has, it must be greater than or equal to -2. Give me 3 numbers that x could be.
-2 -25 -20 -15 -10 -5 0 5 10 15 20 25 Numbers greater than -2 are to the right of -2 on the number line. • If you said -1, 0, 1, 2, 3, 4, 5, etc., you are right. • There are also numbers in between the integers, like -1/2, 0.2, 3.1, 5.5, etc. • The number -2 would also be a correct answer, because of the phrase, “or equal to”.
< or > means not including the number • Use an open circle • Graph points to the left. Notice: when the variable is on left side, the sign shows direction of solution
All numbers greater than or equal to 2 • ≤ or ≥ means including the number • Use an closed (full) circle • Graph points to the right.
Try on your own… 1. At what number do we plot our circle? 2. Is our circle open or closed? 3. Is our variable on the left? If so, shade the graph in the same direction the symbol is pointing.
1. At what number do we plot our circle? 2. Is our circle open or closed? 3. Is our variable on the left? If so, shade the graph in the same direction the symbol is pointing.
Notice: when the variable is on the right side, shade the graph the OPPOSITE direction the symbol is pointing OR rewrite the inequality sentence to get the variable on the left. CAUTION-when you rewrite the sentence to get your variable on the left, you must also switch the direction of the symbol!
Writing an Inequality from a Graph 1. Write down the variable on the left (we read left to right) 2. Decide if the arrow is pointing towards bigger or smaller numbers • Is the circle open or closed? 3. Open < or > Closed ≤ or ≥ (number included in solution set) 4. Write the inequality symbol 5. Write down the number the circle is plotted on
Could you write an inequality for this graph? • Write down the variable on the left (we read left to right) • Decide if the arrow is pointing towards bigger or smaller numbers • Is the circle open or closed? • Open < or > • Closed ≤ or ≥ • Write the inequality symbol • Write down the number the circle is plotted on
Could you write an inequality for this graph? • Write down the variable on the left (we read left to right) • Decide if the arrow is pointing towards bigger or smaller numbers • Is the circle open or closed? • Open < or > • Closed ≤ or ≥ • Write the inequality symbol • Write down the number the circle is plotted on
Could you write an inequality for this graph? • Write down the variable on the left (we read left to right) • Decide if the arrow is pointing towards bigger or smaller numbers • Is the circle open or closed? • Open < or > • Closed ≤ or ≥ • Write the inequality symbol • Write down the number the circle is plotted on
Steps to Solving Inequalities • Follow the same rules and steps that we used to solve an equation. • Always undo addition or subtraction first, then multiplication or division. • Remember whatever is done to one side of the inequality must be done to the other side. 4. The goal is to get the variable by itself.
-25 -20 -15 -10 -5 0 5 10 15 20 25 Solve an Inequality w + 5 < 8 - 5 -5 w < 3 All numbers less than 3 are solutions to this problem!
-25 -20 -15 -10 -5 0 5 10 15 20 25 More Examples 8 + r ≥ -2 -8 -8 r -10 All numbers greater than-10 (including -10) ≥
-25 -20 -15 -10 -5 0 5 10 15 20 25 More Examples 2x > -2 2 2 x > -1 All numbers greater than -1 make this problem true!
-25 -20 -15 -10 -5 0 5 10 15 20 25 More Examples 2h + 8 ≤ 24 -8 -8 2h ≤ 16 2 2 h ≤ 8 All numbers less than 8 (including 8)
Your Turn…. • Solve the inequality and graph the answer. • x + 3 > -4 • 6d > 24 • 2x - 8 < 14 • -2c – 4 < 2 • x > -7 • d > 4 • x < 11 • c < -3