Download
1 / 47
470 likes | 482 Views
Lecture 3 觀測與推估 – IPCC AR4 Assessment Report (2007). http://www.ipcc.ch/. Human and Natural Drivers of Climate Change.

E N D
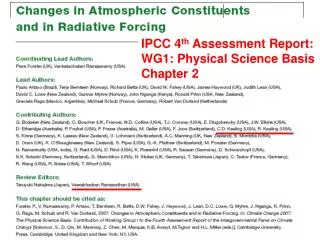
Human and Natural Drivers of Climate Change • Global atmospheric concentrations of carbon dioxide, methane and nitrous oxide have increased markedly as a result of human activities since 1750 and now far exceed pre-industrial values determined from ice cores spanning many thousands of years. (溫室氣體含量) • The understanding of anthropogenic warming and cooling influences on climate has improved since the Third Assessment Report (TAR 2001), leading to very high confidence that the globally averaged net effect of human activities since 1750 has been one of warming, with a radiative forcing of +1.6 [+0.6 ~ +2.4] Watt m-2. (輻射作用) (Radiative Forcing)
CO2: 280 ppm (pre-industrial value) to 379 ppm (2005), exceeds the natural range (180 to 300 ppm) over the last 650,000 years.
Direct Observations of Recent Climate Change 1. Warming of our climate system is unequivocal, as is now evident from observations of increases in global average air and ocean temperatures, widespread melting of snow and ice, and rising global mean sea level. • Updated 100-year linear trend (1906–2005) of 0.74°Cis larger than the corresponding trend for 1901-2000 given in the TAR of 0.6°C. • Balloon-borne and satellite measurements of lower- and mid-tropospheric temperature show warming rates that are similar to those of the surface temperature record. • average atmospheric water vapour content has increased since at least the 1980s over land and ocean as well as in the upper troposphere.
Not a good news at all Warming is becoming faster !
Linear trend of water vapor content over oceans is ~ 1.2% per decade
Future Projection Assessed Likelihood • Virtually certain > 99% 幾乎確定 • Extremely likely > 95% 極端可能 • Very likely > 90% 非常可能 • Likely > 66% 可能 • More likely than not > 50% 比較可能 • Unlikely < 33% 不可能 • Very unlikely < 10% 非常不可能 • Extremely unlikely < 5% 極端不可能
Understanding and Attributing Climate Change • Most of the observed increase in globally averaged temperatures since the mid-20th century is very likely due to the observed increase in anthropogenic greenhouse gas concentrations. • Discernible human influences now extend to other aspects of climate, including ocean warming, continental average temperatures, temperature extremes and wind patterns
Projections of Future Changes • A major advance of AR4 compared with the TAR is the large number of simulations available from a broader range of models. • For the next two decades a warming of about 0.2°C per decade is projected for a range of SRES emission scenarios. Even if the concentrations of all greenhouse gases and aerosols had been kept constant at year 2000 levels, a further warming of about 0.1°C per decade would be expected. • Continued greenhouse gas emissions at or above current rates would cause further warming and induce many changes in the global climate system during the 21st century that would very likelybe larger than those observed during the 20th century.
A1. The A1 storyline and scenario family describes a future world of very rapid economic growth, global population that peaks in mid-century and declines thereafter, and the rapid introduction of new and more efficient technologies. Major underlying themes are convergence among regions, capacity building and increased cultural and social interactions, with a substantial reduction in regional differences in per capita income.
A1 The A1 scenario family develops into three groups that describe alternative directions of technological change in the energy system. The three A1 groups are distinguished by their technological emphasis: fossil intensive (A1FI), non-fossil energy sources (A1T), or a balance across all sources (A1B) (where balanced is defined as not relying too heavily on one particular energy source, on the assumption that similar improvement rates apply to all energy supply and end use technologies).
A2. The A2 storyline and scenario family describes a very heterogeneous world. The underlying theme is self-reliance and reservation of local identities. Fertility patterns across regions converge very slowly, which results in continuously increasing population. Economic development is primarily regionally oriented and per capita economic growth and technological change more fragmented and slower than other storylines.
B1. The B1 storyline and scenario family describes a convergent world with the same global population, that peaks in mid-century and declines thereafter, as in the A1 storyline, but with rapid change in economic structures toward a service and information economy, with reductions in material intensity and the introduction of clean and resource-efficient technologies. The emphasis is on global solutions to economic, social and environmental sustainability, including improved equity, but without additional climate initiatives
B2. The B2 storyline and scenario family describes a world in which the emphasis is on local solutions to economic, social and environmental sustainability. It is a world with continuously increasing global population, at a rate lower than A2, intermediate levels of economic development, and less rapid and more diverse technological change than in the B1 and A1 storylines. While the scenario is also oriented towards environmental protection and social equity, it focuses on local and regional levels.
6.4 4.0 1.8 1.1
Future rainfall changes(2090-2099, vs. 1980-1999) Consistency between models is not as good as Tsfc.
未來氣候變遷推估的科學信賴度 • 全球優於區域 • 全球大部分地區平均氣溫明顯上升 • 海水溫度明顯上升,海面明顯上升 • 雨量變化不確定性高,尤其是小區域(e.g.,台灣) • 劇烈天氣與極端氣候發生頻率的變化,不確定性高 • 各項推估都有一定程度的不確定性 (from various sources)
認知與想法 • IPCCAR4: • IPCC報告是根據數百(?)篇論文,整理出來的結果。 • 資料不完美,但或許是有史以來,最完整的資料。 • 模式仍有許多缺點,但是有史以來的最佳模式。 • 氣候變遷科學的本質: • Projection, not prediction Scenario Approach and Risk Assessment (probability) (不精確科學) • Small signal/noise ratio • Forcing problem: • 如果forcing夠大(如,> 560ppmv) large signal/noise ratio? more reliable projection?
認知與想法 • 趨勢: • 可預見的未來,沒有明顯跡象顯示溫室氣體排放會顯著減緩 • 如果沒有顯著的全球性冷卻機制抗衡,暖化趨勢可能性高 • 暖化地球的天氣與氣候 - 完全陌生的秘境 • 全面性影響?無任何尺度現象可以避免? • 研究:From Cloud to Global Scale as an Integrated System
問題: • 不確定性高:尺度越小,不確定性越高 如何將大尺度變遷信息降到台灣(甚至更小)尺度? • 如何面對? • 不確定性高,wait for mature technology and definite result? • 利用目前最佳資訊,採取風險評估策略,「反覆」(調整)評估天氣與氣候的可能變遷?
策略:End-to-End Approach 歷史氣候變遷研究 … 未來氣候變遷研究 … … 動態調整機制 氣候變遷推估 衝擊研究與風險評估 政策規劃 成功的先決條件:1.紮實的基礎研究, 2.豐富的資料,3.良好的工具,4. 良好的互動,5.足夠的時間與資源
Average Arctic temperatures increased at almost twice the global average rate in the past 100 years. Satellite data since 1978 show that annual average Arctic sea ice extent has shrunk by 2.7 [2.1 to 3.3]% per decade, with larger decreases in summer of 7.4 [5.0 to 9.8]% per decade. • Significantly increased precipitation: eastern parts of North and South America, northern Europe and northern and central Asia. • Drying: Sahel, the Mediterranean, southern Africa and parts of southern Asia. • Long-term trends have not been observed for the other large regions assessed. • More intense and longer droughts have been observed over wider areas since the 1970s, particularly in the tropics and subtropics. • The frequency of heavy precipitation events has increased over most land areas, consistent with warming and observed increases of atmospheric water vapour. • Widespread changes in extreme temperatures have been observed over the last 50 years. Cold days, cold nights and frost have become less frequent, while hot days, hot nights, and heat waves have become more frequent.
There is observational evidence for an increase of intense tropical cyclone activity in the North Atlantic since about 1970, correlated with increases of tropical sea surface temperatures. • There are also suggestions of increased intense tropical cyclone activity in some other regions where concerns over data quality are greater. • Multi-decadal variability and the quality of the tropical cyclone records prior to routine satellite observations in about 1970 complicate the detection of long-term trends in tropical cyclone activity. • There is no clear trend in the annual numbers of tropical cyclones.
2. Some aspects of climate have not been observed to change. • Updated observations reveal that DTR has not changed from 1979 to 2004 as both day- and night-time temperature have risen at about the same rate. The trends are highly variable from one region to another. • Antarctic sea ice extent continues to show inter-annual variability and localized changes but no statistically significant average trends, consistent with the lack of warming reflected in atmospheric temperatures averaged across the region. • There is insufficient evidence to determine whether trends exist in the meridional overturning circulation of the global ocean or in small scale phenomena such as tornadoes, hail, lightning and dust-storms.
A PALEOCLIMATIC PERSPECTIVE • Paleoclimate information supports the interpretation that the warmth of the last half century is unusual in at least the previous 1300 years. The last time the polar regions were significantly warmer than present for an extended period (about 125,000 years ago), reductions in polar ice volume led to 4 to 6 metres of sea level rise.
The observed widespread warming of the atmosphere and ocean, together with ice mass loss, support the conclusion that it is extremely unlikelythat global climate change of the past fifty years can be explained without external forcing, and very likely that it is not due to known natural causes alone. • It is likelythat there has been significant anthropogenic warming over the past 50 years averaged over each continent except Antarctica. • Difficulties remain in reliably simulating and attributing observed temperature changes at smaller scales. On these scales, natural climate variability is relatively larger making it harder to distinguish changes expected due to external forcings. • Temperatures of the most extreme hot nights, cold nights and cold days are likelyto have increased due to anthropogenic forcing. It is more likely than notthat anthropogenic forcing has increased the risk of heat waves.
Warming is expected to be greatest over land and at most high northern latitudes, and least over the Southern Ocean and parts of the North Atlantic ocean. • Snow cover is projected to contract. Sea ice is projected to shrink in both the Arctic and Antarctic under all SRES scenarios. • It is very likelythat hot extremes, heat waves, and heavy precipitation events will continue to become more frequent. • Based on a range of models, it is likely that future tropical cyclones (typhoons and hurricanes) will become more intense, with larger peak wind speeds and more heavy precipitation associated with ongoing increases of tropical SSTs. • Increases in the amount of precipitation are very likelyin high-latitudes, while decreases are likely in most subtropical land regions, continuing observed patterns in recent trends.