Download

1 / 23
230 likes | 354 Views
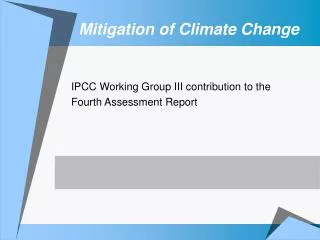
Mitigation of Climate Change. IPCC Working Group III contribution to the Fourth Assessment Report. Bert Metz Co-chair IPCC WG III UNFCCC, Bonn, May 12, 2007. The people. Lead Authors: 168 from developing countries: 55 From EITs: 5 from OECD countries: 108 Contributing authors: 85

E N D
Mitigation of Climate Change IPCC Working Group III contribution to the Fourth Assessment Report Bert Metz Co-chair IPCC WG III UNFCCC, Bonn, May 12, 2007
The people • Lead Authors: 168 • from developing countries: 55 • From EITs: 5 • from OECD countries: 108 • Contributing authors: 85 • Expert Reviewers: 485
Total GHG emissions Between 1970 and 2004 global greenhouse gas emissions have increased by 70 % 60 GtCO2-eq/yr 55 50 45 40 35 30 25 20 15 10 5 0 2004 1970 1980 1990 2000
With current climate change mitigation policies and related sustainable development practices, global GHG emissions will continue to grow over the next few decades • IPCC SRES scenarios: 25-90 % increase of GHG emissions in 2030 relative to 2000 GtCO2eq/yr 2030
Substantial economic potential for the mitigation of global GHG emissions over the coming decades • Both bottom-up and top-down studies • Potential could offset the projected growth of global emissions, or reduce emissions below current levels TOP-DOWN BOTTOM-UP Global economic potential in 2030 Note: estimates do not include non-technical options such as lifestyle changes
What does US$ 50/ tCO2eq mean? • Crude oil: ~US$ 25/ barrel • Gasoline: ~12 ct/ litre (50 ct/gallon) • Electricity: • from coal fired plant: ~5 ct/kWh • from gas fired plant: ~1.5 ct/kWh
Mitigation potential • Economic potential: • takes into account social costs and benefits and social discount rates, • assuming that market efficiency is improved by policies and measures and • barriers are removed • Market potential: • based on private costs and private discount rates • expected to occur under forecast market conditions • including policies and measures currently in place • noting that barriers limit actual uptake
All sectors and regions have the potential to contribute Note: estimates do not include non-technical options, such as lifestyle changes.
Changes in lifestyle and behaviour patterns can contribute to climate change mitigation • Changes in occupant behaviour, cultural patterns and consumer choice in buildings. • Reduction of car usage and efficient driving style, in relation to urban planning and availability of public transport • Behaviour of staff in industrial organizations in light of reward systems
What are the macro-economic costs in 2030? • Costs are global average for least cost appoaches from top-down models • Costs do not include co-benefits and avoided climate change damages [1] This is global GDP based market exchange rates. [2] The median and the 10th and 90th percentile range of the analyzed data are given. [3] The calculation of the reduction of the annual growth rate is based on the average reduction during the period till 2030 that would result in the indicated GDP decrease in 2030. [4] The number of studies that report GDP results is relatively small and they generally use low baselines.
Illustration of cost numbers GDP GDP without mitigation 80% 77% GDP with stringent mitigation Time current ~1 year
There are also co-benefits of mitigation • Near–term health benefits from reduced air pollution may offset a substantial fraction of mitigation costs • Mitigation can also be positive for: energy security, balance of trade improvement, provision of modern energy services to rural areas, sustainable agriculture and employment
Literature since TAR confirms that there may be effects from Annex I countries action on the global economy and global emissions, although the scale of carbon leakage remains uncertain • Fossil fuel exporting nations (in both Annex I and non-Annex I countries) may expect, as indicated in TAR, lower demand and prices and lower GDP growth due to mitigation policies. The extent of this spill over depends strongly on assumptions related to policy decisions and oil market conditions • Critical uncertainties remain in the assessment of carbon leakage. Most equilibrium modelling support the conclusion in the TAR of economy-wide leakage from Kyoto action in the order of 5-20%, which would be less if competitive low-emissions technologies were effectively diffused.
Long-term mitigation: stabilisation and equilibrium global mean temperatures • The lower the stabilisation level the earlier global CO2 emissions have to peak Multigas and CO2 only studies combined
Long term mitigation (after 2030) • Mitigation efforts over the next two to three decades will have a large impact on opportunities to achieve lower stabilization levels [1] The best estimate of climate sensitivity is 3ºC [WG 1 SPM]. [2] Note that global mean temperature at equilibrium is different from expected global mean temperature at the time of stabilization of GHG concentrations due to the inertia of the climate system. For the majority of scenarios assessed, stabilisation of GHG concentrations occurs between 2100 and 2150. [3] Ranges correspond to the 15th to 85th percentile of the post-TAR scenario distribution. CO2 emissions are shown so multi-gas scenarios can be compared with CO2-only scenarios.
Technology • The range of stabilization levels can be achieved by • deployment of a portfolio of technologies that are currently available and • those that are expected to be commercialised in coming decades. • This assumes that appropriate and effective incentives are in place for development, acquisition, deployment and diffusion of technologies and for addressing related barriers
What are the macro-economic costs in 2050? [1] This is global GDP based market exchange rates. [2] The median and the 10th and 90th percentile range of the analyzed data are given. [3] The calculation of the reduction of the annual growth rate is based on the average reduction during the period till 2050 that would result in the indicated GDP decrease in 2050. [4] The number of studies that report GDP results is relatively small and they generally use low baselines.
A wide variety of policies is available to governments to realise mitigation of climate change • Studies of economic potentials show what might be achieved if appropriate new and additional policies were put into place to remove barriers and include social costs and benefits • Applicability of national policies depends on national circumstances, their design, interaction, stringency and implementation • The literature suggests that successful international agreements are environmentally effective, cost-effective, incorporate distributional considerationsand equity, and are institutionally feasible
An effective carbon-price signal could realise significant mitigation potential in all sectors • Policies that provide a real or implicit price of carbon could create incentives for producers and consumers to significantly invest in low-GHG products, technologies and processes. • Such policies could include economic instruments, government funding and regulation • For stabilisation at around 550 ppm CO2eq carbon prices should reach 20-80 US$/tCO2eq by 2030 (5-65 if “induced technological change” happens) • At these carbon prices large shifts of investments into low carbon technologies can be expected
Sustainable development and climate change mitigation • Making development more sustainable by changing development paths can make a major contribution to climate change mitigation • Implementation may require resources to overcome multiple barriers. • Possibilities to choose and implement mitigation options to realise synergies and avoid conflicts with other dimensions of sustainable development.
The full SPM can be downloaded from www.ipcc.chFurther information:IPCC Working group III Technical Support Unit:ipcc3tsu@mnp.nl
Illustration of cost numbers GDP growth rate without mitigation 3%/yr Average annual GDP growth rate (%) 2.88%/yr GDP growth rate with stringent mitigation current Time