Download
1 / 19
190 likes | 196 Views
GLAST Large Area Telescope Overview and Science Update Peter F. Michelson Stanford University peterm@stanford.edu. GLAST User’s Committee Meeting, June 6, 2005. LAT Update. . Tracker. ACD [surrounds 4x4 array of TKR towers]. e –. e +. Calorimeter.

E N D
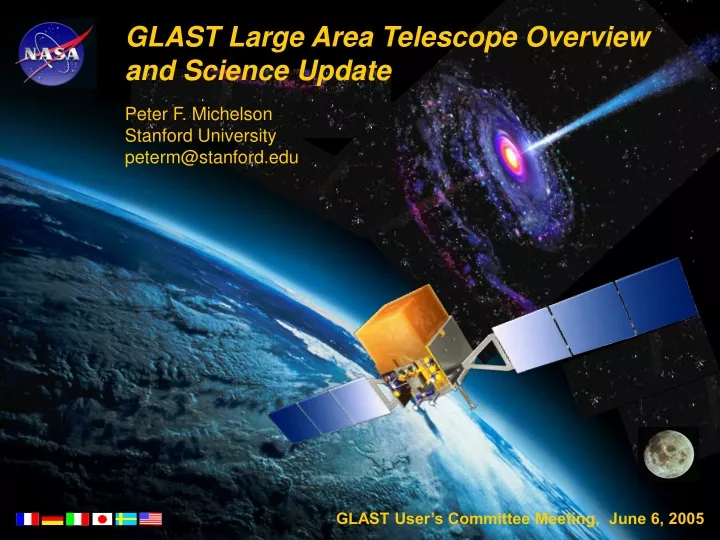
GLAST Large Area Telescope Overview and Science Update Peter F. Michelson Stanford University peterm@stanford.edu GLAST User’s Committee Meeting, June 6, 2005
LAT Update Tracker ACD [surrounds 4x4 array of TKR towers] e– e+ Calorimeter • flight hardware production and integration well underway • 4 flight towers (TKR, CAL, TEM,) installed in Grid • Schedule: • instrument assembly and system test complete: January 2005 • instrument environmental tests at NRL complete: April 2006 • LAT delivery to Spectrum-Astro (General Dynamics) for integration with spacecraft: June 2006
LAT Flight Hardware Integration Preparation of flight grid for TCS integration Flight Tracker in Cleanroom at SLAC LAT Integration stand with PAP ready for proof test Flight Calorimeter
First Integrated Tower – Muon Candidate Event Tracker planes YZ projection XZ projection Calorimeter crystals
GLAST Discovery Reach • Many opportunities for exciting discoveries: • determine the origin(s) of the high-energy extragalactic diffuse background • measure extragalactic background light to z > 3 • detect g-ray emission from clusters of galaxies; cosmic-ray acceleration on large scales • detect g-rays from Ultra-Luminous Infrared Galaxies; cosmic ray acceleration efficiency and star formation rate • detect high-latitude Galactic Inverse-Compton emission and thereby measure TeV-scale CR electrons in the Galaxy • study high-energy emission from Galactic pulsars • the unknown!
3rd EGRET Catalog GLAST Survey: ~10,000 sources (2 years) GLAST Survey: ~300 sources (2 days)
GLAST science capabilities - resolution Unidentified EGRET sources • source identification requires a multiwavelength approach • localization • variability source localization (68% radius) - g-ray bursts: 1 to tens arcminutes - unid EGRET sources: 0.3’ – 1’
Cosmology: Origin of Extragalactic Diffuse Radiation discovery space • blazars • normal galaxies • cluster mergers • primordial diffuse • new physics EGRET constrains blazars to be > 25% of diffuse; annihilation of cosmological neutralinos has, in principle, a distinctive spectral signature Seyfert I galaxies E2 dJ/dE (keV/(cm2-s-keV-sr) steep-spectrum quasars EGRET Type 1a Supernovae Seyfert II galaxies Energy (keV) LAT baseline background limit from Elasser & Mannheim, astro-ph/0405235 • origin is a mystery; either sources there for GLAST to resolve (and study!) OR there is a truly diffuse flux from the early Universe Unique science for GLAST
Cosmology: Probing Extragalactic Background Light opaque opacity t for source at z 70% of EGRET sources (|b|>10o) are blazars 4.8 GHz radio survey; chose bright flat-spectrum sources 95% of radio-selected sources are blazars g-ray energy (GeV) No significant attenuation below 10 GeV • High-redshift (z > 2.5) blazar detections important for visible-UV EBL studies and blazar/galaxy evolution measure flux E>10 GeV/flux E>1 GeV model A model B number of sources in bins of z luminosity-function dependent (important science for GLAST!)
Data Challenges • “End-to-end” alpha testing of science analysis software. • Exercises the simulation/analysis chain from low level detector simulations to top level science analysis and data servers. • Walk before running: design a progression of studies. • DC1. Modest goals. Contains most essential features of a data challenge. • 1 simulated day all-sky survey simulation • find the sources, including GRBs • a few physics surprises • exercise: • exposure, orbit/attitude handling, data processing pipeline components, analysis tools • DC2 in early 2006. More ambitious goals, incorporate lessons learned from DC1. ~One simulated month. • toy one-month catalog. • add source variability (AGN flares, pulsars). • include GBM. • DC3 in 2007. Support for flight science production. see http://www-glast.slac.stanford.edu/software/Workshops/Feb04DC1CloseOut/coverpage.htm
The DC1 Sky One day all-sky survey. Generated E>20 MeV. E>100 MeV with some other cuts for illustration Lots to analyze! A few surprises to find…
Data Challenge 1 Sky 3C273 3C279 isotropic diffuse • a number of physics • surprises in the DC1 • data, including: • 110 GeV gamma-ray line source at the galactic center • new source populations • and a twist on history! Sources – 3EG and more, with a twist
DC2 Improved Sky/Source Model • ~ 1 month of LAT observations will produce a significantly more detailed view of the GeV gamma-ray sky than that provided by EGRET. • Sky model will be much more detailed than the model used for DC1. • Greater range of source classes. • More detailed models of source behaviour (variable AGN, periodic pulsars…). • Improved luminosity distributions, source locations; include EBL effects consistently. • Updated diffuse Galactic emission model. • More detailed orbit/attitude profile and include effect of SAA. • Use updated event reconstruction, background rejection and Instrument response functions. Include minor/expected hardware failures and glitches (dead channels, etc.). • GRBs will be simulated in both the LAT and GBM.
DC2 Data Access and Analysis • More detailed sky model and simulated data allow more sophisticated analyses. • Produce AGN light curves. • Periodicity analysis of pulsars. • Joint spectral analysis of GBM and LAT data for GRB. • Produce “toy” catalog. • Detailed source sensitivity and localization studies. • This will test and exercise many important areas including: • Data servers for ease of use • Data formats for completeness. • Science analysis tools for usability • Documentation • Processing times • Data volumes • Data transfer rates
DC2 Schedule • Team members have been actively preparing for DC2 since January 2005. • Kickoff in January 2006 with release of simulated data. • Close out meeting 2-3 months later.