Download
1 / 67
670 likes | 675 Views
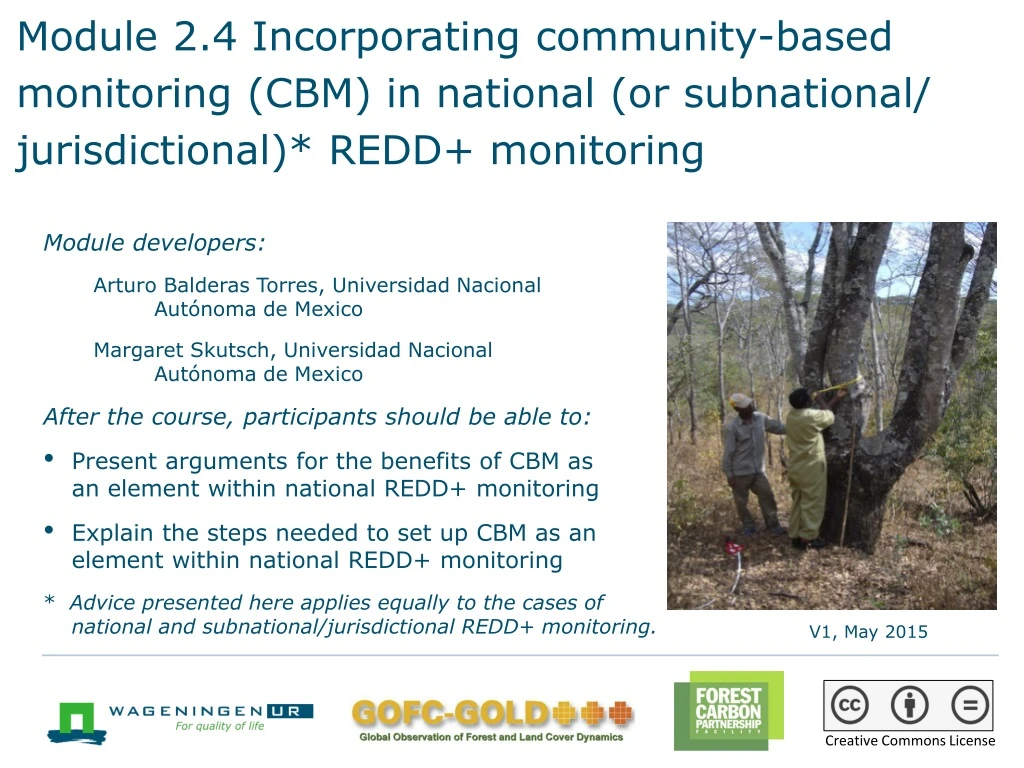
Module 2.4 Incorporating community-based monitoring (CBM) in national (or subnational/ jurisdictional)* REDD+ monitoring. Module developers: Arturo Balderas Torres, Universidad Nacional Autónoma de Mexico Margaret Skutsch, Universidad Nacional Autónoma de Mexico

E N D
Module 2.4 Incorporating community-based monitoring (CBM) in national (or subnational/ jurisdictional)* REDD+ monitoring Module developers: Arturo Balderas Torres, Universidad Nacional Autónoma de Mexico Margaret Skutsch, Universidad Nacional Autónoma de Mexico After the course, participants should be able to: • Present arguments for the benefits of CBM as an element within national REDD+ monitoring • Explain the steps needed to set up CBM as an element within national REDD+ monitoring * Advice presented here applies equally to the cases of national and subnational/jurisdictional REDD+ monitoring. V1, May 2015 Creative Commons License
Background material • GOFC-GOLD. 2014. Sourcebook. Section 3.4. • IPCC (International Panel on Climate Change). 2003. Good Practice Guidance for Land Use, Land-Use Change and Forestry. • Skutsch, M. 2011. Community Forest Monitoring for the Carbon Market: Opportunities under REDD+. • Danielsen et al. 2013. “Community Monitoring for REDD+: International Promises and Field Realities. Ecology and Society. • FCPF (Forest Carbon Partnership Facility). 2011. “Linking Community Monitoring to National Measurement, Reporting, and Verification for REDD+.” Report on an FCPF workshop.
Background material • Balderas Torres, A. 2014. Potential for Integrating Community Based Monitoring into REDD+. Forests. • Balderas Torres, A. 2013. Opportunities and challenges for integrating CBM into MRV systems for REDD+ in Mexico. The Nature Conservancy. Consultancy Report, Mexico, D.F. Available online • Danielsenet al. 2011. “At the Heart of REDD+: A Role for Local People in Monitoring Forests?” Conservation Letters. • McDicken, K. 1997. A Guide to Monitoring Carbon Storage in Forestry and Agroforestry Projects. • UNFCCC COP (United Nations Framework Convention on Climate Change Conference of the Parties). 2010. Report of the Conference of Parties on Its 15th Session, Held in Copenhagen from 7–19 December 2009.
Outline of the lecture • Why CBM shouldbe part of national monitoring for REDD+ • How CBM can relate to the national forest monitoring system (NFMS) and national monitoring • Setting up protocols for CBM • Monitoring other (noncarbon) variables • How to feed local data into a national database • Other issues: Verification and the basis of benefit sharing • How much does CBM cost? • Planning a national CBM monitoring exercise
Outline of the lecture • Why CBM should be part of national monitoring for REDD+ • How CBM can relate to the national forest monitoring system (NFMS) and national monitoring • Setting up protocols for CBM • Monitoring other (noncarbon) variables • How to feed local data into a national database • Other issues: verification and the basis of benefit sharing • How much does CBM cost? • Planning a national CBM monitoring exercise
Role of communities in national monitoring for REDD+ (1/2) • Monitoring systems for REDD+ include many activities related to design, planning, data gathering, processing, report, and verification of the information. • Community-based monitoring (CBM) refers to those monitoring systems where communities play an active role in one or more of these activities depending on the design or the scheme, local skills, resources, and capabilities. • Usually communities play a more active role in data gathering at local level.
Role of communities in national monitoring for REDD+ (2/2) • Countries have been requested to create national forest monitoring systems. • Data requirements include levels and changes of forested area and carbon stocks (geographical/activity data and carbon stock change factors). • Data is required for construction of the national forest reference emission levels (FRELs) and forest reference levels (FRLs). • A phased approach starting with relatively low accuracy data (Tier 1) migration toward advanced levels (Tier 3) could be greatly increased by CBM.
Community engagement in REDD+ monitoring (1/2) • The UNFCCC COP recognized that implementation of REDD+ requires full engagement of indigenous groups and local communities, and monitoring could be a good way to promote participation (UNFCCC COP 2010). • Countries have different starting points in terms of data availability. • Where communities are engaged in managing forests, such data could be gathered more easily.
Community engagement in REDD+ monitoring (2/2) • Phased approach to monitoring for REDD+ (see Module 1.1): • Emissions Factors: Tier 1 Tier 2 Tier 3 (local data, carbon content/dynamics) (see Module 2.3) • Activity/Geographical Data: Approach 1 2 3 (frequent, descriptive information of land uses and land-use changes, with high resolution) (see Module 2.1) • CBM offers the opportunity to provide Tier 3, Approach 3 data, although only in the areas where communities are actively engaged in forest management and/or REDD+ activities. • Identification of managed areas as new stratum, to help explain the variability of carbon stocks and changes and to reduce uncertainties in estimates
Opportunity for CBM within phased approach for building NFMSs Source: Balderas Torres (2013)
Advantages of CBM • Accurate measurements • Enables frequent update of data • Low-cost data gathering • Access to remote areas • Multifunctional • Transparent • Improvesdecision making
Initial challenges for including CBM into national monitoring systems for REDD+ • Consistency of methods with IPCC guidelines, National Greenhouse Gas Inventory (NGHGI) and the FREL/FRL submitted to UNFCCC for REDD+. • Consistent use of definitions of forest. • Data should be consistent across communities producing data through CBM (variables, methods, and formats). • Standardized protocols are required.
Outline of the lecture • Why CBM should be part of national monitoring for REDD+ • How CBM can relate to the national forest monitoring system (NFMS) and national monitoring • Setting up protocols for CBM • Monitoring other (noncarbon) variables • How to feed local data into a national database • Other issues: verification and the basis of benefit sharing • How much does CBM cost? • Planning a national CBM monitoring exercise
Integrating CBM into national measuring, reporting, and verification (MRV) and NFMS Assumption: National REDD+ program is implementing a top-down approach based on interpretation of satellite imagery and Tier 1 and possible Tier 2 carbon data (national forest inventories).
Main opportunities for integrating CBM into national MRV and NFMS Source: Balderas Torres (2014)
Opportunity 1. Data gathering in public programs • Activities developed to increase sample size of forest inventories: • Community brigades • As part of existing programs (PES, conservation, CFM, etc.) • Main benefit: wages for brigades, access to public programs. • Easier to align protocols to national systems.
Opportunity 2. Activities driven by local access to benefits and co-benefits • Access to local, direct benefits motivates CBM (e.g., water supply, timber, and nontimber forest products). • There is a need to align protocols to national systems. • Agreements over data ownership are needed. • It is necessary to ensure management practices have positive impacts on carbon.
Opportunity 3. Information from projects in carbon markets and certification schemes • Projects participating in carbon markets or schemes such as Fair Trade, Organic, and FSC can provide data for MRV systems. • There can be benefitsfor local peoplefrom carbon credits and premiums for certified products.
Opportunity 4. Implementation of safeguards • There is a need to document implementation of safeguards. • These activities may not be linked to forest inventories, but documentation can provide geographical data of regions participating actively in REDD+.
Discussion 1 • Which of the four opportunities for CBM that have been identified do you think would be most useful in the case of your own country? Consider the following: • Are there public schemes targeting community forest management/conservation practices? • Are there CFM practices in which implementation is driven by communities? Are communities interested in the local provision of specific environmental services? • Are communities participating in carbon markets or other certification schemes? • Are communities actively participating in REDD+ implementation? How can participation be documented?
Discussion 2 CBM can be carried out only in areas where communities are actively engaged in community forest management and/or REDD+ activities: • How much of the country could be monitored in this way? Would the data be useful if it is patchy? • Could and should CBM be made compulsory, as a condition for participating in REDD+? • Should people be paid to do it (separately from any funds disbursed for forest management itself or for carbon performance)?
Outline of the lecture • Why CBM should be part of national monitoring for REDD+ • How CBM can relate to the national forest monitoring system (NFMS) and national monitoring • Setting up protocols for CBM • Monitoring other (noncarbon) variables • How to feed local data into a national database • Other issues: verification and the basis of benefit sharing • How much does CBM cost? • Planning a national CBM monitoring exercise
Standardized protocols for CBM • Data should be compatible with NFMS. • It is necessary that data facilitate comparisons and evaluation among different REDD+ interventions. • Standardized protocols (i.e., variables and methods) are needed. • Methods needed for stock and stock-changes in permanent plots (stock-difference method). • Statistics of management practices can also provide information to assess emissions and removals (gain-and-loss method). • Methods can be selected ad hoc according to local context. • This data can add to that of national inventories to increase sample size.
Functions of CBM in national monitoring • Forest area and area changes (monitoring of deforestation) are difficult for CBM to monitor most likely through remote sensing. • Primary aim of a CBM survey is to measure carbon stocks and changes in carbon stock in community forests. • CBM can also provide geographical information of forest areas under management (i.e., participatory mapping), • New areas of afforestation may also be included. • CBM allows accurate identification of forest trajectories and supports the analysis of drivers of emissions.
General approaches to set up protocols (1) Methods to estimate carbon stocks: • Set up a forest inventory and collect data of individual trees via DBH (caliper/tape) and height (clinometer) and later use of allometric equations to estimate biomass See manual provided for this course, or any of those listed following: • Wood Hole Research Institute: http://www.whrc.org/resources/fieldguides/carbon/pdf/chapter6.pdf. • The KTGAL project: http://www.communitycarbonforestry.org/. The link is under Resources, Community Monitoring. • The Nepal-based network ANSAB: http://www.ansab.org/wp-content/uploads/2010/08/Carbon-Measurement-Guideline-REDD-final.pdf. • UN REDD Vietnam: http://www.un.org.vn/en/component/docman/cat_view/130-un-viet-nam-joint-publications/209-climate-change-joint-un-publications.html?orderby=dmdate_published. • Winrock International: http://202.99.63.183/tanhui/thjl/Winrock%20International%20%E7%A2%B3%E7%9B%91%E6%B5%8B%E6%8C%87%E5%8D%97.pdf.
General approaches to set up protocols (2) • Set up measurement plots to determine basal area visually (relascope) and apply modified allometric equations to estimate biomass • Obtain figures of volume of timber and apply biomass expansion factors (visually or remotely, i.e., drones and/or LiDAR) Methods to estimate changes in carbon stocks: • Take repetitive measurements of stocks in plots • Quantify reductions and increments of biomass and carbon in forests in a given period (gain-loss method); understand management practices and dynamics of carbon in the forest; have access to associated statistics and censuses
Processes Leading to losses/reductions and gains/increments in the different carbon pools Source: Balderas Torres (2013)
Discussion 3 • Under what circumstances would you recommend using the gain-loss method instead of stock change estimation, and why? • Relascopes are generally used in the timber industry and often in plantation forests where the variation between sizes of trees is relatively small: • Do any of the participants have experience in their use? • Would the relascope pick up differences in woody biomass if used, say, in annual surveys of savanna forests (miombo, selva baja, cerrado, etc.)?
Advantages and disadvantages of different approaches Stock-difference, gain-loss, visual methods, LiDAR: • Variables to measure • Cost of equipment • Capacities and technical skills required • Maintenance and calibration • Steps required for data analysis
Acceptable error level • Need to select the level of error that is acceptable in estimating the mean carbon stock. • Acceptable level of error is usually 10% or 5%. • The value selected will affect the number of sampling plots that are required.
Advantages and disadvantages of different confidence levels • A lower level of error means that the mean value of the estimate of carbon is more likely to be correct. • However, this requires many more sampling plots. • Hence there is a trade-off in terms of the need for accurate data and the costs involved in achieving it. • The levels of error to be used may be set by companies or organizations buying carbon credits or financing REDD+ activities.
Sampling • The size and shape (circular or rectangular) of sampling plots needs to be selected: • Circular plots are easier for communities to lay out • In open forests where the number of tree stems per hectare is low, larger sampling plots will be needed than in dense forests. • It is common practice to use nested plots in which a small plot is defined within the larger one: • In this case, all trees above a given diameter at breast height (e.g., DBH >10cm) are measured in the large plot, but smaller trees (say, 2.5–10 cm diameter) are measured only in the smaller, inner plot
Typical plot sizes for forest inventories Source: MacDicken 1997.
Scope: Carbon pools • Possible pools to be measured: • Aboveground tree biomass • Belowground tree biomass (roots) • Soil carbon • Shrub layer (bushes, etc.) • Litter layer (leaves) • Deadwood (fallen branches, etc.) • When should a pool be included? • If it is expected to change (increase) due to the REDD+ management practices introduced • Or alternatively if it is likely to be negatively affected
Equipment and technology The data recording technology to be used: • Paper based data collection or electronic? • Tailor made apps for smartphones or tablets for CBC (mostly freeware) • If electronic, which of the different systems available would be most suitable?
Skills required for different technologies as part of CBM (Larrazabal and McCall, forthcoming)
Advantages of electronic recording of data • User-friendly interfaces on smartphones and tablets make entry of data quick and easy. • Less risk of errors in transmission if the data is entered into the database at the time of measurement. • Less time spent on coding and analyzing data after the fieldwork is finished. • The GPS coordinates of the plot can be automatically registered and associated with the data. • Photographs can be taken using the same equipment and directly associated with the biomass data in the database.
Disadvantages of electronic recording of data • Equipment (smartphones, tablets) may not be available. • Battery life can be a problem: • Back up batteries or solar chargers can be a solution • In some conditions (dense forest, deep valleys) GPS signals may not be easy to obtain. • Training is obviously necessary, but can be easily done for a selected software system
Discussion 4 • What is the availability of smartphones in rural communities in your country? • The alternative is for the community to use paper recording formats: the supervising organization/NGO transcribes the data into the database on a PC or laptop.Which system do you consider to be more reliable?
Frequency of measurements • Monitoring takes time and is costly to the community. • Frequency should be established depending on changes in management practices and expected growth rates (detectable changes). • However, the more frequent the measurements, the greater the reliability of the data; trends can be more easily seen and errors caught and corrected. • Consider the need for retraining for infrequent measurements.
Outline of the lecture • Why CBM should be part of national monitoring for REDD+ • How CBM can relate to the national forest monitoring system (NFMS) and national monitoring • Setting up protocols for CBM • Monitoring other (noncarbon) variables • How to feed local data into a national database • Other issues: verification and the basis of benefit sharing • How much does CBM cost? • Planning a national CBM monitoring exercise
Monitoring other (noncarbon) variables • REDD+ projects can deliver benefits additional to emissions reductions: • Biodiversity conservation, enhanced forest governance, water services, etc. • There is a possibility of using electronic system to record data relating to safeguards. • A need exists to establish a protocol and appropriate methodologies for monitoring specific noncarbon benefits. Discussion: • Do you think that standard protocols are possible for safeguards, or are they too different in different areas to allow this? What elements should be included?
Monitoring drivers of deforestation and forest degradation • Monitoring changes in drivers could help to anticipate changes in emissions and removals. • Changes are related to management practices inside and outside forests (e.g., silvicultural activities, protective activities, changes in agricultural practices, efficient stoves, etc.). • Communities could identify drivers and document key indicators. • Understanding the impact of changes in drivers is very important for evaluating approaches to dealing with deforestation and degradation.
Outline of the lecture • Why CBM should be part of national monitoring for REDD+ • How CBM can relate to the national forest monitoring system (NFMS) and national monitoring • Setting up protocols for CBM • Monitoring other (noncarbon) variables • How to feed local data into a national database • Other issues: verification and the basis of benefit sharing • How much does CBM cost? • Planning a national CBM monitoring exercise
Integrating local data into a national database • Protocols will have to ensure CBM data is compatible with NFMS. • CBM can densify existing inventories. • CBM can add a new layer to estimate carbon stocks and changes in managed areas: • It has the potential to evaluate the impact of different management practices • It is possible to design participatory systems (direct upload of data by communities). • Data ownership and protection need to be considered.
Example of integration of local data (1) • National systems can become participatory to allow the integration of local geographical and carbon data. • Example:In a national system a region is classified as Tropical and Oak Forest • But one subarea could be under improved forest management by a community, (blue) • A community can provide local data on the managed area Based in Balderas Torres (2013)
Example of integration of local data (2) Table 1. The information in a national system (Tier 1) Table 2. Local information of the blue polygon can be integrated as a new stratum and polygon… up-date area, carbon and uncertainties (Tier 1 to Tier 3) Based on Balderas Torres (2013) The inventory can be recalculated including local information
Technical difficulties in feeding CBM data into a national data base For maps, uncertainty can be estimated depending on scale and size of forest polygons. Table. Uncertainty of polygons of different size at different map scales (in ha) Communities can produce accurate data for small managed areas, but if national MRV systems do not increase the scale, uncertainty will not decrease, unless large areas under management are consolidated. Based on Balderas Torres (2013)
Outline of the lecture • Why CBM should be part of national monitoring for REDD+ • How CBM can relate to the national forest monitoring system (NFMS) and national monitoring • Setting up protocols for CBM • Monitoring other (noncarbon) variables • How to feed local data into a national database • Other issues: verification and the basis of benefit sharing • How much does CBM cost? • Planning a national CBM monitoring exercise
Verification and the basis for benefit sharing • Verification is important as part of CBM: • Without verification, communities may report, for example, only positive results, and they may be tempted to exaggerate the results • Third party verification (V in MRV) is always required and could be carried out on a sampling basis. • Different methods can be used at different stages: • For example: Stock-difference method when the project begins, gain-loss method for follow-up, and stock-difference methods for (sampled) verification