Download
1 / 52
530 likes | 603 Views
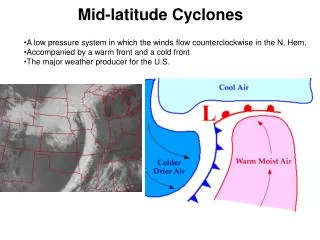
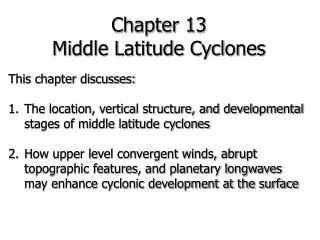
Middle Latitude Cyclones. This chapter discusses: The location, vertical structure, and developmental stages of middle latitude cyclones How upper level convergent winds, abrupt topographic features, and planetary longwaves may enhance cyclonic development at the surface.

E N D
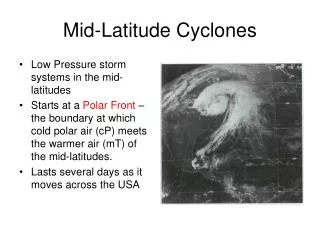
Middle Latitude Cyclones • This chapter discusses: • The location, vertical structure, and developmental stages of middle latitude cyclones • How upper level convergent winds, abrupt topographic features, and planetary longwaves may enhance cyclonic development at the surface
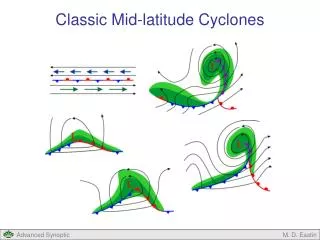
Polar Front Theory – Wave Cyclone Cycle Stage 1 Stage 2 Frontal Wave Stage 3 Stage 1: One explanation for development of middle latitude cyclones begins with a stationary front with warm and cold winds in opposite directions (e.g. wind shear). Stage 2: A wavelike kink, such as a low pressure system creates a frontal wave, or incipient cyclone under the right conditions. Stage 3: As the storm develops into an open wave, a broad band of precipitation forms ahead of the warm sector. Open Wave Overrunning Precipitation
Stage 4 Stage 3a Stage 5 • Energy driving their development originates from kinetic sources such as rising warm air, sinking cold air, and converging air, as well as latent heat of condensation. • Stage 4: When occlusion occurs when cold air lies on both sides of the occluded front. Without an ample supply of energy of rising, warm, moist air, the system will dissipate. • Stage 5: The end stage is where precipitation-free area is observed. In addition, only a weak cyclonic circulation is seen in the wind field.
Wave Cyclone Development • A series, or family, of cyclones, at various stages of development, may extend across North America. • Energy driving their development originates from kinetic sources such as rising warm air, sinking cold air, and converging air, as well as latent heat of condensation. • Baroclinic instability drives the middle latitude cyclones even further.
Baroclinic instability arises from temperature advection. Where on the globe is there an overall strong thermal gradient and why?
Cyclone & Anticyclone Paths • Many well known paths for low and high pressure systems extend across North America, and their interaction helps develop the open wave cyclone. • Cyclogenesis describes the strengthening or development of these storms into huge unstable waves. • Cyclones developing on the eastern slopes of the Rockies are called lee-side lows and are sometimes associated with redevelopment of previous systems come onshore from the Pacific Ocean.
Initial Development of Wave Cyclone • Jet streak upstream of short-wave trough (often diffluent) • Sinking motion upstream of trough axis • PVA aloft over incipient surface low • Weak surface system downstream of short-wave trough • Elongated area of clouds (baroclinic leaf) parallel to mid-level flow • Near surface low center: low-level convergence, upper-level divergence, rising motion, and pressure falls
Rapid Development Stage • 500 hPa trough amplifies (height falls west of trough axis and height rises downstream ) • Cyclonic circulation results in warm advection to east and cold advection to west of surface low • Temperature advection yields dipole vertical motion field • Comma cloud develops • Surface pressures fall due to net warming of column (low-level WAA + tropopause undulation) • Surface low moves east-northeast towards greatest pressure falls and max upward motion
Mature (Open Wave) Stage • mid-tropospheric flow changes dramatically; trough becomes negatively tilted • SW flow increases SW of surface low • Absolute vorticity increases • Jet core migrates to southwest of surface • Expansion of clouds around warm front and west of surface low • Narrower cloud band along and behind cold front • Some western clouds are Sc by mixing • Dry slot develops due to subsidence; part of dry conveyor belt and high IPV air entering system
Occluded (Maximum Intensity) Stage • Center cut off from warm sector • Cold air at mid-lower levels over cyclone • 500 hPa vorticity maximum near surface low center • “Stacked” system in vertical – advections are small • Broad west-east cloud shield • Occlusion not completely due to cold front catching up to warm front – but to low moving into cold air due to dynamic processes • Increasing ascent NW of low + cold advection yields thickness minimum which coincides with cyclone center • Warm air in upper trop/lower stratosphere overlays cold mid-lower tropospheric air, allows pressures to fall
As westerly winds flow over a mountain range, the airflow is deflected to the south initially. • These air parcels after traversing over the mountain range will reemerge with a northeasterly path. • This motion leads to a formation of a semi-persistent trough feature on the eastern plains of Colorado called a lee-side trough. • If there is enough upper-level support, this setup can develop even further and creating a lee-side low. • This concept is associated with the “conservation of potential vorticity.” Lee-Side Cyclone
Convergence & Divergence • Rapid intensification of cyclones is prohibited when low pressure aloft is directly above the surface low. • In this scenario, the convergence at the surface low builds up air pressure and fills in the low with excessive mass. • The same stacking of high pressure, with divergence at the surface, will weaken the anticyclone. • In order for a surface cyclone to strengthen, a high pressure must be over it and vice versa for a surface high pressure. • This configuration will allow for mass to be transported through the atmosphere and promote a constant up or downward vertical motion. Not idealized case for cyclogenesis H L L H Idealized case for cyclogenesis
Storm Vertical Structure • Divergence of air aloft occurs as height contours intervals widen. • Low pressure systems deepen and intensify (e.g. cyclogenesis) when upper-level divergence is stronger than the surface convergence, which requires a vertical staggering of surface and upper lows. • When more air converges at the surface than it is removed at the top, this signifies a storm is filling or dissipating and weakening as surface pressure rises.
Divergence and Convergence DIV = Divergence CON = Convergence • Convergence or confluence of air aloft creates downward motion. • Divergence or diffluence of air aloft generates upward motion.
Upper Level Waves • Earth's poles are encircled by 3 to 7 longwaves, or Rossby waves, directing upper level winds around lows at the 500 mb surface. • Longwaves or Rossby waves are more trend maker than weather maker. • Small disturbances in these Rossby waves can trigger storms.
Shortwave Disturbance • Shortwave troughs within the larger Rossby wave move faster, and propagate downwind into the Rossby troughs and cause them to deepen. • Barotropic conditions, where height contours and isotherms are parallel (no temperature advection) dominate in Rossby waves. • Within shortwaves, the height contours and isotherms are usually slight out of phase creating temperature advection. • A shortwave can deepen or amplify a longwave collapse into a baroclinic state.
Weak Baroclinicity - Weak Temperature Advection 5C 10C 1500 m Vg 1530 m
Strong Baroclinicity - Strong Temperature Advection 5C 0C 1500 m Vg 1530 m
No Baroclinicity - No Temperature Advection(Equivalent Barotropic Atmosphere) 1500 m 5C Vg 1530 m 10C
Vertical Baroclinicity – Tilting of the System with Increasing Heights L L Cold Cold Cold Cold Cold Cold z L L x Cold Cold
Classic ETC Model – Open Wave L500 Lsfc Warm Sector
Classic ETC Model – Occlusion L500 Lsfc Warm Sector
Cyclone Development: Upper Winds A) C) B)
Atmospheric conditions at the surface and aloft affect cyclogenesis. • An upper level shortwave can trigger baroclinic instability, which converges flow aloft upstream, raises high pressure, and supports cold air advection. • Downwind, divergent flow aloft deepens the surface low, and warm advection increases rising air flow. • Eventually the system occludes.
Jet Streak Influence Divergence aloft is enhanced by the polar front and/or subtropical jet streams, where the jet maximum, or jet streak, forms in the tightly packed gradients.
Jet Streak Convergence & Divergence • Jet streaks can help to intensify a surface cyclone even farther. • The polar front or subtropical jet streak forces air convergence aloft upstream of the deepening open wave cyclone, and then divergence downstream where the surface cyclone is located. • When these wind maximums are gone, the cyclone degrades.
Left Exit Quadrant Upward Motion Left Front Region Downward Motion 90 kt Movement of the Jet Streak 70 kt Right Front Region Upward Motion Right Exit Quadrant Downward Motion
Summary of Cyclone Weather Upper and surface maps illustrate the role of convergence and divergence aloft, and the pattern of clouds, precipitation, and temperatures on the ground. A mid-latitude cyclone experiences its maximum intensity when the upper-level low or trough is juxtaposed to the northwest of the surface low pressure. The upper- and lower-level lows are tilted vertically to provide for the maximum upward vertical motion.
Old Model Conveyor Belt Model Old but Slightly Revised Model • This model describes rising and sinking air along three conveyor belts, warm conveyor belt rises with water vapor above the cold conveyor belt which also rises and turns. • Finally the dry conveyor belt descends brining clearer weather behind the storm.
Revised View of Conveyor Belts Illustrating 3-D Deformation Ng (2005) Doctoral Dissertation
Comma Clouds • Rising and turning moist air, illustrated in the conveyor belt model, condenses into a large comma-shaped cloud typical of the open wave cyclone. • This March 1993 storm wreaked havoc along the East Coast.
3/93 Storm Size & Pressure For the storm of the century, the low pressure center reached 980 mb, and the storm extended across several southeastern states.
3/93 Storm Temperature Advection Upper level winds flowed along a deep trough with steep baroclinic cold and warm air advection.
Storm of Century Path Low pressure values and location are charted with time to illustrate the storm track and intensity, moving from Texas to Maine in 2 days.
Vorticity & Cyclone Spin • Vorticity describes the spin of an air parcel, which is positive in counterclockwise cyclonic flow. • Due to the conservation of angular momentum, vorticity increases with a decrease in parcel radius (e.g. stretching due to divergence aloft) (local vorticity) and increase in earth's latitude (earth’s vorticity).
4 Types of Vorticity • Relative (local) • Earth’s (Coriolis parameter; f =2sin) • Absolute (local + earth’s) • Potential (absolute + depth)
Sources of Vorticity • Curvature of upper level heights and winds, as well as strong changes in wind speed, or shear, generate the spin of relative vorticity. • Additional earth’s vorticity is generated by the earth's spin, and together they comprise absolute vorticity.
Curvature Vorticity + y x
Shear Vorticity y x
Absolute Circulation = Constant = Absolute Vorticity x Area DIV as vorticity decreases, area increases CON as vorticity increases, area decreases y x
Trough to Ridge Vorticity Change Anticyclonic spin around a ridge reduces absolute vorticity, but the convergence and cyclonic spin in the trough enhance the relative vorticity and hence increases absolute vorticity as well
+ + 2 Div+ Div Div Con Con+
Maximum at the base of the trough: > 0; > 0 45N PVA NVA 40N Minimum at the crest of the ridge: < 0; >> 0 35N PVA NVA 30N
Vorticity & Vertical Motion • The 500 mb map vorticity maximum is a signal that to its east, air is diverging aloft. • If there is also convergence below, then an open wave cyclone will likely deepen. • Hence, 500 mb charts are useful in analyzing “vorticity maximum” and predict potential storms in a quick, crude way.
Vertical Storm Profile Surface, 500 mb, and 200 mb charts are used to illustrate the structure of the February 1983 open wave cyclone exploding over North Carolina. The 500 mb chart shows a shortwave dashed line moving into the longwave trough and baroclinic cold air advection.
February 1983 Vorticity • Lines of equal vorticity are plotted on the 500 mb chart for the February 1983 open wave cyclone that buried the east coast in snowfall. • Note that the “vort max” is west of the storm center, strengthening the cyclogenesis.
Imaging Vorticity Centers GOES West satellite infrared imagery of water vapor are useful in identifying swilling vorticities, seen off Pacific Northwest coast.
Potential Vorticity = Absolute Vorticity / Depth = Constant TROPOPAUSE PV 0: D < 0 PV > 0: D > 0 PV > 0: D > 0