Download
1 / 39
390 likes | 523 Views
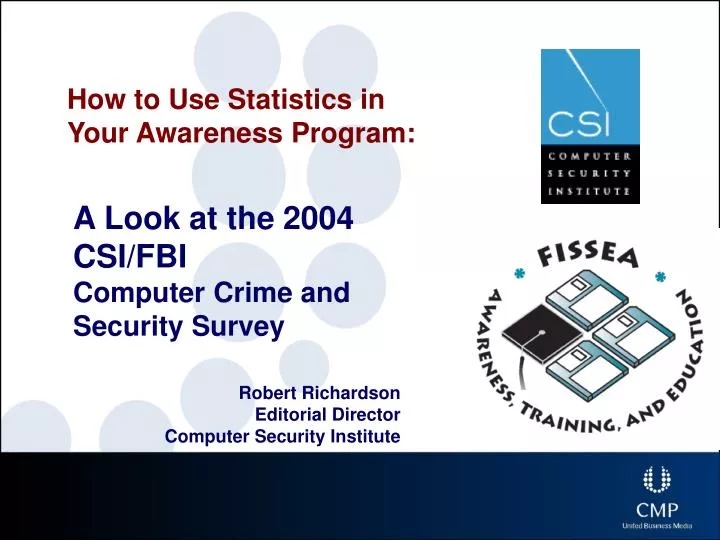
How to Use Statistics in Your Awareness Program:. A Look at the 2004 CSI/FBI Computer Crime and Security Survey. Robert Richardson Editorial Director Computer Security Institute. Called the cops?. Utility 5%. Other 19%. Manufacturing 12%. Local Gov. 3%. State Gov. 3%.

E N D
How to Use Statistics in Your Awareness Program: A Look at the2004 CSI/FBI Computer Crime and Security Survey Robert Richardson Editorial Director Computer Security Institute
Utility 5% Other 19% Manufacturing 12% Local Gov. 3% State Gov. 3% Financial 19% Federal Gov. 7% Telecom 2% Legal 1% Education 7% Retail 3% Transportation 1% Medical 6% High Tech 13% Respondents by Industry By industry sector : Figure 1 High Tech 13%
Respondents by Employees 50,000 or more 7% 1 – 99 19% 10,000 – 49,999 14% By number of employees : Figure 2 100 – 499 15% 1,500 – 9,999 31% 500 – 1,499 13%
Under $10M 20% Under $10M 20% Over $1B 37% Over $1B 37% $10M - $99M 23% $10M - $99M 23% $100M – $1B 20% $100M – $1B 20% Respondents by Revenue By revenue : Figure 3 2004: 392 Respondents
The Eternal Question • Can I use anything you just told me for my awareness program?
The Eternal Question • Can I use anything you just told me for my awareness program? • Not exactly….
Types of attack by percent Virus Insider Abuse Laptop/Mobile Theft
Coffee Cup Deviation Figure 15: dollar losses
Cybercrime Losses Figure 15: dollar losses
Cybercrime Losses Figure 15: dollar losses
How to Use… • Average losses in a survey of about 500 security professionals were down for the third straight year. • While this is good news (paying attention to security seems to reduce crime), it’s also true that identity fraud—the costs of which aren’t directly measured in this survey—are skyrocketing.
Tell a Credible Truth • Be sure the base in survey statistics is justified • Consider the magnitude of change arising from possible different interpretations of data
14) What is the total monetary value of losses your organization sustained due to electronic crimes or system intrusions in 2003? We do not track monetary losses due to electronic or related crimes (Base: 500) 32.4% (Base: 338) $100 million or more 0.3% $10 million to $99.9 million 2.4% $1 million to $9.9 million 5.0% $500,000 to $999,999 5.0% $100,000 to $499,999 11.2% Less then $100,000 26.3% Don’t know/not sure 49.7% source: CSO magazine/U.S. Secret Service/CERT Coordination Center.
CSO/Secret Service/CERT Survey Mean $3,920,000 Median $100,000 Sum* $666,000,000 *Sum figure calculated using midpoints within each range. source: CSO magazine/U.S. Secret Service/CERT Coordination Center.
(Base: 338) $100 million or more 0.3% 1 $10 million to $99.9 million 2.4% 8 $1 million to $9.9 million 5.0% 17 $500,000 to $999,999 5.0% 17 $100,000 to $499,999 11.2% 38 Less then $100,000 26.3% 89 Don’t know/not sure 49.7% 168
(Base: 338) $100 million or more 1 100,000,000 $10 million to $99.9 million 8 439,600,000 $1 million to $9.9 million 17 92,650,000 $500,000 to $999,999 17 12,750,000 $100,000 to $499,999 38 11,400,000 Less then $100,000 89 4,450,000 Total: 660,850,000 Don’t know/not sure 49.7%
(Base: 338) $100 million or more 1 100,000,000 $10 million to $99.9 million 8 80,000,000 $1 million to $9.9 million 17 17,000,000 $500,000 to $999,999 17 8,500,000 $100,000 to $499,999 38 3,800,000 Less than $100,000 89 4,450,000 Total: 213,750,000 Don’t know/not sure 49.7%
IT Budget Allocation Irrelevant!* *at least for awareness programs
Per Employee Irrelevant!* *at least for awareness programs
Tools & Technology *at least for awareness programs Irrelevant!*
Financial Metrics Strange But True! (Might Be Relevant!)
Anecdotes Make Stats Real • The number of bot-infected computers declined from 30,000+ a day in July to an average of less than 5,000 a day by December, according to Symantec. (The Register) • The [Honeynet Project] report pointed out that "more than one million hosts are compromised and can be controlled by malicious attackers" although it warned that this was a probable underestimate. The company also made an estimate as to the scope of distributed denial of service (DDOS) attacks. In the tracking period, from November 2004 to January 2005, Honeynet detected a staggering 226,585 IP addresses joining at least one of the channels being monitored. (Techworld.com)
Anecdotes Make Stats Real • an executive at a satellite TV firm in Massachusetts has been charged with hiring several botnets to disrupt the websites of three rivals, costing one of their web-hosting firms $1 million. (New Scientist.com)
Tie to Policy • Obviously, anyone acting like this executive would be dismissed and possibly criminally prosecuted • Policies used to “lock down” systems are in part in place to prevent your system from becoming a “bot.” • If your system is compromised, it may be used to perpetrate crimes.
Takeaways • Use believable stats – explain important elements such as sample skew • Graphic representations of comparison stats are often easier to interpret
Takeaways • Keep it positive (for the most part) • Relate statistics to anecdotes, then tie to policies.
Contact: Robert Richardson rrichardson@cmp.com GoCSI.com
Contact: Robert Richardson rrichardson@cmp.com GoCSI.com