Download
1 / 60
610 likes | 720 Views
Nod & Shuffle at Magellan. LCIR Survey Update. GDDS Preview. October 18 2002. Conventional Slit Spectroscopy. Sky subtraction is primary limitation Slit irregularities Flat-field errors Residual Fringing Geometric distortions Low slit density on sky Beam switching ?

E N D
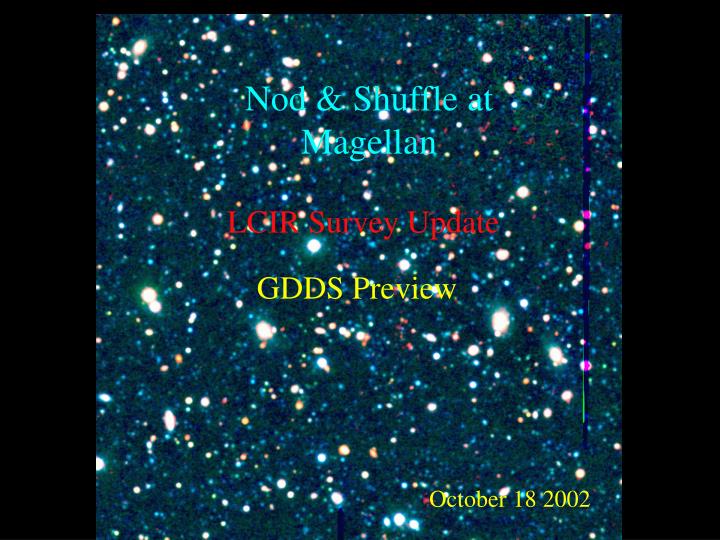
Nod & Shuffle at Magellan LCIR Survey Update GDDS Preview October 18 2002
Conventional Slit Spectroscopy • Sky subtraction is primary limitation • Slit irregularities • Flat-field errors • Residual Fringing • Geometric distortions • Low slit density on sky • Beam switching ? • Variable sky spectrum • Read noise penalty • High read-out overhead • The solution: ‘nod & shuffle’
First Exposure Obscured Charge Storage Area Active slit area Obscured Charge Storage Area
Now nod telescope and shuffle charge “B” position “A” position
“B” position “A” position Nod & shuffle the other way
LBL High Resistivity CCDs No fringing, but high CR rates
LBL High Resistivity CCDs Straight average - 2 hours Nod & Shuffle
LBL High Resistivity CCDs +/- 200 DN rejection
A B A-B Sky cancellation: ‘nod and shuffle’ Storage of ‘sky’ image next to object image via ‘charge shuffling’Zero extra noise introduced, rapid switching (60s) Typically A=60s/15 cy: 1800s exposure10-3 subtraction
GMOS N&S Sky residuals SUMMED along long slit (1.8 arcmin) Cycle:A=60sB=60s + 25s o/head Raw Sky/20 Subtracted sky (i.e. ~10-3 level is enough for 200,000 sec pointed obs.)
Nod & Shuffle on IMACS 2’’ slits 2’’ gaps
Micro-Shuffling on IMACS 2” slits 2” gaps 4000A per spectrum
Macro-Shuffling on IMACS High Slit Density or IFU mode
Macro-Shuffling on IMACS High Slit Density or IFU mode
Macro-Shuffling on IMACS High Slit Density or IFU mode
Technical and Practical Considerations • Telescope, Guider and CCD controller must be well synchronized • Active Optics must work with short dwell time • Overheads must be minimized • Mask making software needs special capabilities • Reduction software (done! -Abraham &Glazebrook) • Order blocking filters?
Las Campanas IR Survey McCarthy, Persson, Martini, Koviak (OCIW) Chen (MIT), Marzke(SFSU), Carlberg, Abraham(UT) Ellis (Caltech) Evolved Galaxies at 1 < z < 2
Las Campanas IR Survey • Goal: Empirical understanding of early galaxy evolution • Target: 1 square degree to K = 21 • Pilot survey in 2000/2001: VRIH to H=20.5 • Six fields around the equator (2 in south!) • 1 square degree in BVRIz’H • 0.5 square degrees in J & K to K = 20.8 • 200+ redshifts with LDSS2 • ~ 50 redshifts with GMOS & LRIS
Color-Magnitude Diagram Stars 0.0 < z < 1.0 1.0 < z < 1.5 1.5 < z < 2.0 500 sq. arcmin
Color-Color Diagrams • Stars form distinct sequence • Z > 1 galaxies appear at K ~ 19 • Z > 1.5 galaxies at K > 20.5
Color-Color Diagrams • Stars form distinct sequence • Z < 1 galaxies well sampled at K ~ 19
Color-Color Diagrams • Stars form distinct sequence • Z > 1 galaxies appear at K ~ 19
Color-Color Diagrams • Stars form distinct sequence • Z > 1 galaxies appear at K ~ 19 • Z > 1.5 galaxies at K > 20
Color-Color Diagrams • Stars form distinct sequence • Z > 1 galaxies appear at K ~ 19 • Z > 1.5 galaxies at K > 20 • Reddest galaxies follow minimal evolution track
Evolving Luminosity Functions • LFs derived from photo-z’s with modified likelihood approach • LF at intermediate z agrees well with CNOC2 • Very little apparent evolution in L* to z ~ 1.2
Gemini Deep Deep Survey GDDS Team: Karl Glazebrook (JHU), Bob Abraham (Toronto), Pat McCarthy (OCIW),Rick Murowinski (DAO), Ray Carlberg (Toronto), Ron Marzke (SDSU), Sandra Savaglio (JHU), H-W Chen (OCIW) David Crampton (DAO), Isobel Hook (Oxford), Inger Jørgensen & Kathy Roth (Gemini) Goal: Deep 100,000 sec MOS exposures on Las Campanas IR Survey fields to get redshifts of a complete K<22.4 I<25 sample covering 1<z<2
Goals: • First Complete sample 1<z<2 • use photo-z’s to weed out low-z galaxies (BVRIzJHK) • Determine luminosity and mass functions • Can we see the assembly of mass? • Massive galaxies at z=2 would severely trouble CDM • Mass(z) more robust than SFR(z) • Relate to galaxy morphology (ACS) • Identify Ell/Sp/Irr over 1<z<2 • Track low-z behavior to high-z • E.g. can we see mass assembly of giant Ellipticals? • Can we track the dynamical evolution of spiral disks • Track SFH over 1<z<2: • Age of galaxies, metallicities of population
GDDS history • Sep 2001: start of GDDS evil planning • Jan 2002: team approached Gemini observatory with nod & shuffle proposal • Feb 2002, obtained Gemini go-ahead. • Feb-May 2002. Implementation of N&S at DAO (~$10K cost) • May 2002: first N&S engineering observations on 8m • July 2002: N&S commissioned on sky • Aug 2002: First 4 nights of GDDS - Science Verification for N&S - success!! • Sep-Dec 2002: Band I queue time, 50 hrs
Gemini + GMOS Gemini GMOS spectrograph Tel.+instr. efficiency GMOSLRISLDSS1 GMOS represents the best possible option for a red sensitive MOS. Ideal system for nod & shuffle
GDDS sample LCIRS4 fields BVRIzJHKs2626Limits:B<26.0 V<26.5R<26.8 I<25.8z<24.7 J<22.5H<22.5Ks<22.4 Use photo-z’s to weed out z<0.7 foreground I<25 typical model n(z):
GDDS mask 84 objects - 2 tiers with150 l/mm grating
GDDS Spectra 77 objects 40,000 secs
[OII] Redshifts from GDDS 23.7 < I(AB) < 24.2