Download

1 / 16
160 likes | 298 Views
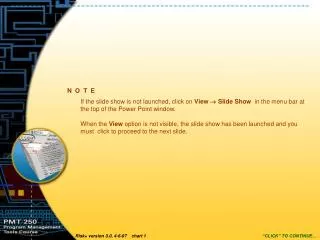
N O T E. If the slide show is not launched, click on View Slide Show in the menu bar at the top of the Power Point window. When the View option is not visible, the slide show has been launched and you must click to proceed to the next slide. “CLICK” TO CONTINUE….

E N D
N O T E If the slide show is not launched, click on View Slide Show in the menu bar at the top of the Power Point window. When the View option is not visible, the slide show has been launched and you must click to proceed to the next slide. “CLICK” TO CONTINUE…
T A S K 4 “CLICK” TO CONTINUE…
T A S K 4 Module 8 Analysis Exercise The purpose of this exercise is to walk you through a 12-step analysis process (see slide 5) using the documents and the automated tools provided. There are tasks associated with each step of the process. To begin this exercise, we recommend you open and minimize all of the documents (if you haven’t or can’t print them for reference) and tools (you will need to use wInsight and MS Project). This will allow you to readily move between documents, using the Microsoft Windows Navigation buttons at the bottom of your screen, as you step through this exercise. “CLICK” TO CONTINUE…
T A S K 4 TASK 4 In Task 3, you will complete steps 9 through 12 of the analysis process (see next slide). To complete these steps you first perform an analysis of cost drivers. Next you will determine an Estimate at Completion (EAC) range. Finally, you will generate an integrated analysis report. “CLICK” TO CONTINUE…
T A S K 4 12-Step Integrated Program Management Model Data Collection Program Requirements Analysis Contract Analysis Technical and Risk Analysis Data Validity Check Network Schedule Analysis Performance Measurement Baseline (PMB) Analysis Schedule Drivers Analysis Cost Drivers Analysis EAC and PAC Forecasts Financial Analysis Reports to Management “CLICK” TO CONTINUE…
T A S K 4 Step 9 – Cost Drivers Analysis Why – Cost Variance is a signal of performance problems & schedule problems. What – Correlate cost metrics from wInsight with the program schedule drivers, with the critical path in the network schedule, and with the technical and risk drivers. TASKS: Open wInsight (if it was closed) Sort wInsight @ lowest level for cumulative CV$ (Top 3) HINT: Use the Lowest/All toggle button on the menu bar ( ) to show only lowest level items HINT: Select SORT => Cost Var Cum You should see the lowest level items sorted in descending order from largest negative cost variance (top) to highest positive variance (bottom) “CLICK” TO CONTINUE…
T A S K 4 Step 9 – Cost Drivers Analysis (cont’d) TASKS (cont’d): Sort wInsight @ lowest level for cumulative CV% (Top 3) HINT: Select SORT => Cost Var Cum % Highlight “VAC” column; right click on column, select COLUMN => INSERT In FIELD dropdown menu, select “CV Percent” You should see the lowest level items sorted in descending order from largest negative cost variance percent (top) to highest positive variance percent (bottom) Open Microsoft Project Jun00 schedule (if it was closed) Correlate CV % and CV$ with critical path tasks Correlate CV% and CV$ with technical drivers from Step 4 (Task 1) Determine possible cost overrun causes “CLICK” TO CONTINUE…
T A S K 4 Step 10 – EAC and PAC Forecasts Why – Required for program management and planning. What – Use EVM performance factors to compute the EAC range. Start with an evaluation of CPR formats 1, 4, and 5 (not used in this exercise). Then compute an EAC range by first computing representative performance factors (e.g., schedule performance index, cost performance index, etc.). The EAC based on the cumulative CPI performance factor (CPICUM) generally represents the best or the floor of the EAC range. The EAC based on the composite performance factor, which is defined as the CPICUM times the SPICUM, generally represents the upper end or ceiling of the EAC range. With the determination of an EAC range, the final step ten task is to add fee or profit to convert the EAC into a price at completion, or PAC (not used in this exercise). “CLICK” TO CONTINUE…
T A S K 4 Step 10 – EAC and PAC Forecasts (cont’d) TASKS: Evaluate Contract Level trends by viewing the following charts in wInsight (select from “Charts” on the tool bar; see next slide for example): CPI and SPI charts EAC chart Contract Performance chart C/S Variance Trends chart “CLICK” TO CONTINUE…
T A S K 4 Step 10 – EAC and PAC Forecasts (cont’d) “CLICK” TO CONTINUE…
T A S K 4 Step 10 – EAC and PAC Forecasts (cont’d) TASKS (cont’d): From wInsight tool bar, select REPORTS => SIX PERIOD SUMMARY. Scroll down to block titled, “Completion Data.” Review Contractor’s BAC, EAC (LRE) & TCPI for both (TCPI-BAC & TCPI-LRE). If you continue scrolling to the bottom of the Six Period Summary, you’ll see a block titled, “Statistical and Independent Forecasts.” There you will find EAC calculations (forecasts) using the performance factors discussed in the Basic Training section of this module. Determine YOUR performance factors – Compute YOUR high, low & most likely EAC, and compute TCPI for each. “CLICK” TO CONTINUE…
T A S K 4 Step 11 – Financial Analysis Why – Determine whether we have a defendable and credible program consistent with APB requirements and the planning, programming, budgeting and execution (PPBE) process. What – Involves reconciling the PPBE budget documents with the PAC estimate (Step 10) and project network and milestone schedules (Step 6); reconciling the CPR formats 1, 3, and 4 with the Contract Funds Status Report (CFSR); and the use of obligation and expenditure reports. The aims are to evaluate the contractor’s funding requirements against available funds, and to confirm the contractor (and possibly subcontractors) has adequate corporate liquidity to complete the program. TASKS: None required for this exercise since the applicable documents are not supplied. “CLICK” TO CONTINUE…
T A S K 4 Step12 – Reports to Management Why – Document results of the preceding 11 steps for leadership and oversight reporting. What – Reports may include contract issues; APB issues, including potential or actual APB breaches requiring milestone decision authority resolution; EV status reports (generally the results of Steps 7, 8, 9 and 10) and financial status report. TASK: Now that you have performed your analysis using the tools, generate a PowerPoint briefing that includes the following items * (continued on next two slides): Current Status (Technical/Schedule/Cost) EV Metrics at Contract Level Schedule Analysis Milestones Critical Path *Include charts and graphs from Project and wInsight to illustrate your analysis “CLICK” TO CONTINUE…
T A S K 4 Step12 – Reports to Management (cont’d) Schedule Drivers CPR data correlated with schedule and technical data Cost Drivers CPR data correlated with schedule and technical data Contractor BAC & EAC w/ TCPIs Government EAC Range w/ TCPIs Identify schedule and cost trends to determine performance factors Determine high-low EAC range and most likely EAC based on trend analysis and technical/programmatic information “CLICK” TO CONTINUE…
T A S K 4 Step12 – Reports to Management (cont’d) APB issues Technical Schedule Cost Impact/Recommendations/Action Technical Schedule Budget “CLICK” TO CONTINUE…
T A S K 4 SAMPLE To print the PowerPoint slides, CLICK on File Print… You will then be prompted to choose your print options. Select them and CLICK OK. “CLICK” TO CONTINUE…