Download
1 / 32
360 likes | 707 Views
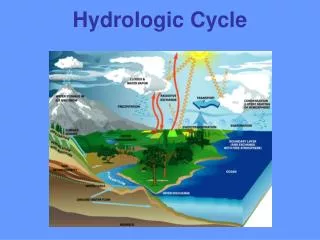
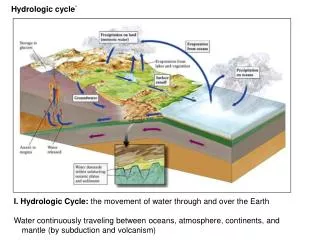
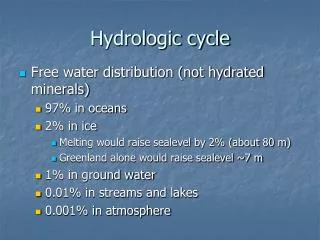
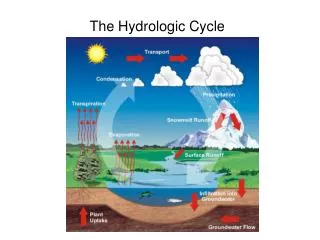
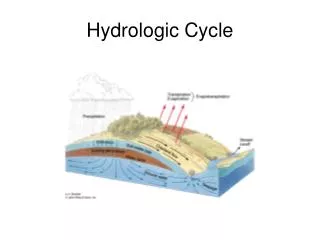
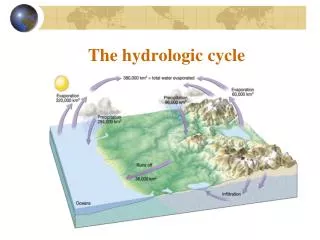
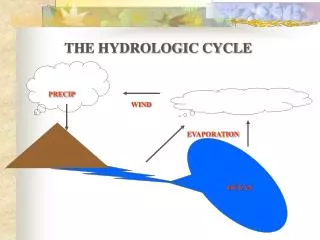
The Hydrologic Cycle. The Hydrologic Cycle. General Topics. Evaporation Transpiration Condensation Precipitation – interception, infiltration, depression storage, Overland Flow Stream Hydrographs Rainfal -Runoff Storm Duration Curves Determining Groundwater Recharge

E N D
General Topics • Evaporation • Transpiration • Condensation • Precipitation – interception, infiltration, depression storage, Overland Flow • Stream Hydrographs • Rainfal-Runoff • Storm Duration Curves • Determining Groundwater Recharge • Measurement of Streamflow Evapotranspiration
Evaporation • Questions : How to measure it? • Mass Balance – account for al flows in, all flows out • Land Pan (4ft diameter, 10 inches deep unpainted galvanisedmetal) – about 450 deployed across USA • Daily records of depth of water, precipitation, replacement water and wind record – empirical relationships
Evaporation • Problems • Averages (One daily/weekly/monthly vs. Continuous) • Highly variable depending on conditions • What does a pan tell us about say something the size of a lake? • Empirical Corrections – EMPIRICAL!! • Works well in lab where conditions are well controlled, but real life is not so simple
Transpiration • Transpiration is the process by which moisture is carried through plants from roots to small pores on the underside of leaves, where it changes to vapor and is released to the atmosphere. • Transpiration is essentially evaporation of water from plant leaves. • Studies have revealed that about 10 percent of the moisture found in the atmosphere is released by plants through transpiration.
Transpiration • How much water do plants transpire? • During a growing season, a leaf will transpire many times more water than its own weight. An acre of corn gives off about 3,000-4,000 gallons (11,400-15,100 liters) of water each day, and a large oak tree can transpire 40,000 gallons (151,000 liters) per year. • Very season, daytime. climate and vegetation dependent • Question to the Audience: Urban vs. Rural?
Evapotranspiration • In the field it is next to impossible to distinguish between evaporation and transpiration so we lump them together. From a water budget perspective we don’t care too much about the details http://www.cranfield.ac.uk/sas/naturalresources/research/projects/dailyet.html Some ET calculators http://ponce.sdsu.edu/onlineshuttleworthwallace.php
Evapotranspiration • Potential evapotranspiration (PET) is the amount of water that could be evaporated and transpired if there were sufficient water available. • Actual Transpiration (AET) is the amount that actually occurs because there is a deficiency of water. • During summer months PET is highest, but so is the potential for water shortage
PET vs AET Diagrams of potential and actual evapotranspiration one in a coarse soil with limited moisture storage; warm, dry summers and cool, moist winters A fine soil with ample soil-moisture storage, warm summers, cool winters and little seasonal variation in precipitation
Measuring Evapotranspiration • Lysimeter – a large container holding soil and plants. Mass Balance: • Debate: Pros/Cons
Condensation • Condensation is the change of the physical state of matter from gaseous phase into liquid phase, and is the reverse of evaporation
Precipitation • Precipitation is water released from clouds in the form of rain, freezing rain, sleet, snow, or hail. It is the primary connection in the water cycle that provides for the delivery of atmospheric water to the Earth. Most precipitation falls as rain.
Measuring Precipitation • As long as the gauge is >3 cm diameter any size gauge should work • US standard – 20cm diameter (8 inches); Canada – 9 cm • Read once a daily normally • Problems: wind/location – place as close to ground as possible, away from trees and buildings, but not too exposed to wind (low brush helps), level ground, sensitive to wind for snow/light rain
Getting Data • In the USA roughly 13500 reporting precipitation stations • NOAA : http://water.weather.gov/ahps/ • http://www.ncdc.noaa.gov/oa/climate/stationlocator.html • http://www7.ncdc.noaa.gov/CDO/cdo
Events during Precipitation • Interception – vegetation can intercept rainfall and delay or prevent water reaching the ground – typically exponential in time • In dense forests can be 8-35% of annual precipitation • When storage capacity exceeded – stem flow
Events during Precipitation - Infiltration • Not all water that falls will reach the water table • Infiltration Capacity is measure of a soils capacity to absorb water • Highly variable – soil type, but also the same soil varies depending on current moisture content • Horton Infiltration Capacity Equation
Infiltration Capacity • What actually infiltrates during precipitation? • Consider the infiltration curve and now draw precipitation on top of it. How much infiltrates (board)
Sample Problem • Consider an infiltration capacity curve with the following parameters: • fc=10mm/hr; fo=120mm/hr;k=1/2 hr-1 • How long does it take for the infiltration capacity to reduce to 10% of its initial value? • If there is a rainstorm of 25mm/hr that lasts 5 hours how much water infiltrates over an area of 100km^2? • If there is a rainstorm of 25mm/hr for the first hour, 10mm/hr for the next two and then 50mm/hr for the final 2how much water infiltrates over the same area? • Finally, what if it falls as 50mm/hr for the first hour, 25mm/hr for the next two and then 10mm/hour for the last 2 hours?
So what happens when infiltration capacity is exceeded? • Depression Storage (Puddles etc) • When depression storage is exceeded Horton Overland Flow occurs - common in arid and semi-arid regions, where rainfall intensities are high and the infiltration capacity is reduced because of surface sealing, or in paved urban areas.
Streams and GroundwaterGaining vs Losing How do you determine which it is? – Groups
Stream Hydrographs – Baseflow Recessions • Baseflow is is the portion of streamflow that comes from subsurface flow • Baseflow recession in a stream occurs when groundwater feed to a stream decreases
Stream Hydrographs – Baseflow Recessions • Complex thing that depends on lots of characteristics in a watershed (topography, drainage, soils +geology)… but often the equation is simple
Sample Problem • Determine a for the following base flow recession curve • Matlab
Determining Ground-Water Recharge from Baseflow Seasonal Recession Method • Find time t1 when Q=Q0/10 • Find Vtp, the volume of potential gw discharge • Calculate potential baseflow at t, the end of the recession • Recharge= Vtp(next season)- Vt(season 1) Apply algorithm to this figure
Determining Ground-Water Recharge from Baseflow Recession Curve Displacement • Find t1 • Compute tc=0.2144t1 • Locate time tc after peak • Extrapolate recession A and B to find QA and QB at tc • Apply equation
Sample Problem • Using the seasonal recession method estimate the ground-water recharge between the end of the first baseflow recession and the the start of the second one • Matlab
Sample Problem • Using the recession Curve Displacement Method find the recharge that caused the displacement in the baseflow recession curve depicted in the figure • Matlab
Open Channel Flow – Manning Equation • Imperial Units V (ft/s)– average velocity R (ft)- hydraulic radius (ratio of cross area to wetted perimeter) S (ft/ft) - energy gradient n – Manning roughness coefficient • Metric Units V (m/s)– average velocity R (m)- hydraulic radius (ratio of cross area to wetted perimeter) S (m/m) - energy gradient n – Manning roughness coefficient a b
Manning Roughness Coefficient Entirely empirical so be very careful with units!!!
Sample Problem • A mountain stream with a rocky bed roughly speaking has vertical sides of depth 20cm and a width of 50 cm. The bottom of the channel drops 2m over a distance 10 m. What is its discharge?