Download
1 / 41
420 likes | 595 Views
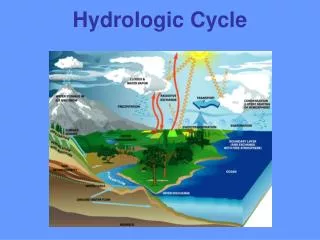
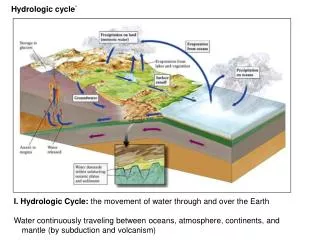
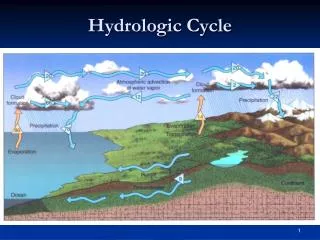
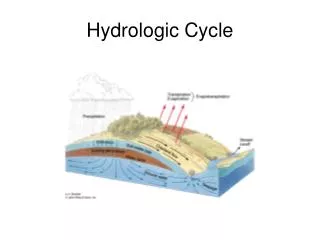
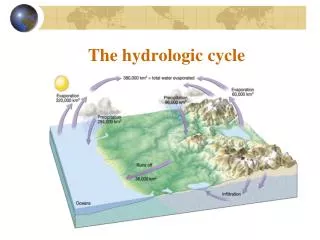
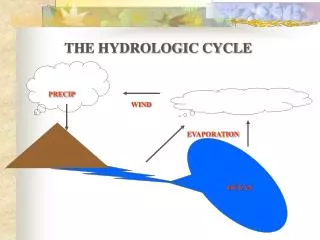
GOVERNMENT OF ANDHRA PRADESH GROUND WATER DEPARTMENT TECHNICAL WORK SHOP ON “ NEERU – MEERU ” WEST GODAVARI DISTRICT ON 25-02-2004 DEPUTY DIRECTOR E L U R U. HYDROLOGIC CYCLE. COMPONENTS OF HYDROLOGICAL CYCLE. Ground water recharge. Soil Moisture. Runoff. Evapotranspiration.

E N D
GOVERNMENT OF ANDHRA PRADESHGROUND WATER DEPARTMENTTECHNICAL WORK SHOP ON“ NEERU – MEERU ”WEST GODAVARI DISTRICTON 25-02-2004DEPUTY DIRECTORE L U R U
COMPONENTS OF HYDROLOGICAL CYCLE Ground water recharge Soil Moisture Runoff Evapotranspiration
Water levels of Piezometer wells in Upland area, W.G.Dt. • The average water levels by end of non-monsoon periods of • May 200217.01 m • January, 2003 18.37 m • Change– 1.36 m • May 200319.79 m • January, 2004 18.34 m • Change + 1.45 m • From the above data it is observed that the depletion of – 1.36 m is attributed to the poor rainfall occurred, where as the accretion of +1.45 m has been resulted only due to the effect of good monsoon rainfall which clubbed with the impact of recharge structures.
Water levels of Piezometer wells in Delta area, W.G.Dt. • The average water levels by end of non-monsoon periods i.e., • May 2002 3.37 m May 2003 3.74 m • January, 2003 2.96 m January, 2004 2.35 m Change + 0.41 m + 1.39 m. • From the data it is observed that the rise of + 0.41 m is attributed the poor rainfall occurred, where as the accretion of + 1.39 m has been resulted only due to the effect of good monsoon rainfall.
Water levels of Piezometer wells in West Godavari District • The average water levels by end of non-monsoon periods i.e., May of 2002 and 2003 were 12.67m and 14.99 m respectively. • By end of January, 2003 and January, 2004 are 13.87 m and 13.66 m respectively. • The change in average water levels from May to January period for the years 2003 and 2004 are obtained as – 1.20 m and + 1.33 m. • From the above data it is observed that the depletion of – 1.23 m is attributed to the poor rainfall occurred, where as the accretion of + 1.33 m has been resulted only due to the effect of good monsoon rainfall which clubbed with the impact of recharge structures taken up in the district.
Norms of Rainfall Infiltration Factor • Sandstone Formation 10% - 14% • Crystalline Formation 10% - 12% • Alluvial Formation • Sandy Area 20% - 25% Clayey sands Area 8% - 12%
Additional Rainwater Recharge through Artificial Recharge Structures in Phase I to VII under Neeru – Meeru Programme in West Godavari District
Obtained by Jan, 2003 No of structures Executed 1197 Total volume created 171.309 LCM Additional GW recharge 102.10 LCM Obtained by Jan, 2004 No of structures Executed 41162 Total volume created 394.520 LCM Additional GW recharge 584.00 LCM Impact of Recharge Structures as Additional Ground Water Recharge
Surface & Ground Water Budget, West Godavari District Surface Water Ground Water • Availability 57179Mcft Availability 24452Mcft • Utilisation 167376Mcft Utilisation 28100Mcft • Balance -110197Mcft Balance -3648Mcft
Water levels of observataion wells near desilted tanks • The average water level during January, 2003 is 5.75 m. • The average water level during January, 2004 is 3.79 m. • Fluctuation from Jan. 03 to Jan. 04 is + 1.96 m (rise). • The rise in water level is due to the effect of relatively good rainfall of 920.5 mm up to January,2004 and the added impact of rainwater recharge structures taken up in the district.
Components of Hydrological Cycle for West Godavari District
Impact of ‘Neeru – Meeru’ Upland Area, West Godavari District • Before “ Neeru _ Meeru” • Ground Water Availability 692.77 MCM • Ground Water Draft 796.15 MCM • Stage of Utilisation 115 % • After “ Neeru _ Meeru” • Storage Area Created 39.45 MCM • Additional Ground Water Recharged 58.40 MCM • Stage Of Utilisation 106 % • Stage of utilisation has brought down from 115% to 106%, with a deviation of 9% improvement
Additional Observations • Ground Water Availability 69277 Ha.m • Ground Water Utilization 79615 Ha.m • Over Drawal of Ground Water -10338 Ha.m • Storage Area to Create 28248 Ha.m • Storage Area Created as on Jan-2004 3945.2 Ha.m • Additional Storage Area to Create 24302.8 Ha.m (243.028 MCM) (2430.28 LCM)
Mandal wise Ground Water Potential Assessment Report of Upland Area, West Godavari District
Mandal Wise Ground Water Resources (Upland Area) W.G. District
Category I (Ground Water Exploitation >100% & Water levels >20m, with declining trend) • Chintalapudi,Lingapalem,Pedavegi,Denduluru,T.Narsapuram,D.Tirumala, • Pedapadu, Nallajarla, Devarapalli,Koyyalagudem,Eluru,Jangareddigudem, • Bhimadolu, Unguturu, Gopalapuram, Tadepalligudem,Kamavarapukota. • Category II (Ground Water Exploitation 90% – 100% & Water levels 15 – 20m with declining trend.) • Nidadavolu, Buttayagudem, Polavaram, Jeelugumilli, Tallapudi • Category III(Ground Water Exploitation 70 – 90% & Water levels 10 – 15m with declining trend ) • Kovvuru, Chagallu • CategoryIV(Ground Water Exploitation 50 – 70% & Water levels 5 – 10m with declining trend ) • Nil • Category V(Ground Water Exploitation < 50% & Water levels > 5m with declining trend ) • All the 22 Delta Mandals