Download
1 / 1
20 likes | 125 Views
THERMAL CONDUCTIVI T Y , THERMAL GRADIEN T , AN D HE A T FLO W ESTIM A TIONS FO R THE SMACKOVE R FORM A TION, SOUTHWES T ARKANSAS Lea Nondorf, Arkansas Geological Surve y , Little Rock, AR Bekki White, Stat e Directo r and Geologist. Thermal Conductivit y of the Smackove r Formation

E N D
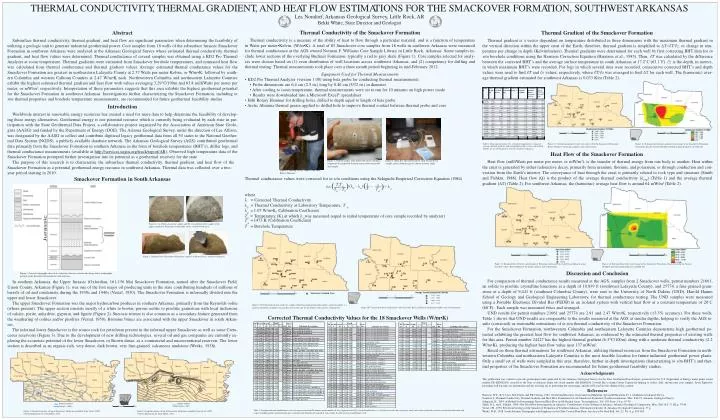
THERMALCONDUCTIVITY,THERMALGRADIENT,ANDHEATFLOWESTIMATIONSFORTHESMACKOVERFORMATION,SOUTHWESTARKANSASTHERMALCONDUCTIVITY,THERMALGRADIENT,ANDHEATFLOWESTIMATIONSFORTHESMACKOVERFORMATION,SOUTHWESTARKANSAS Lea Nondorf,ArkansasGeologicalSurvey,Little Rock,AR BekkiWhite, StateDirectorandGeologist • Thermal Conductivity of the SmackoverFormation • Thermalconductivityisameasureoftheabilityofheattoflowthroughaparticularmaterial,andisafunctionoftemperatureinWattspermeter•Kelvin,(W/m•K).Atotalof83Smackovercoresamplesfrom18wellsinsouthwestArkansasweremeasured forthermalconductanceattheAGSownedNormanF.WilliamsCoreSampleLibraryinLittleRock,Arkansas. Somesamplesin- cludelowersectionsoftheoverlyingBucknerFormation,typicallyaredtograyshale(Figure1).Coresamplesselectedforanaly- seswerechosenbasedon(1)evendistributionofwelllocationsacrosssouthwestArkansas,and(2)competencyfordrillingand thermal testing.Thermal measurementstook place over a three month period beginning in mid-February2012. • Equipment Used for Thermal Measurements • KD2 ProThermalAnalyzer (version 1.08) using beta probe for conducting thermal measurements • Probe dimensions are 6.4 cm (2.5 in.) long by 0.40 cm (5/32 in.) in diameter • After cooling to room temperature, thermal measurements were set to run for 10 minutes on high power mode • Results were downloaded into a Microsoft Excel®spreadsheet • Hilti Rotary Hammer for drilling holes, drilled to depth equal to length of beta probe • ArcticAlumina thermal grease applied to drilled hole to improve thermal contact between thermal probe and core Abstract Subsurfacethermalconductivity,thermalgradient,andheatflowaresignificantparameterswhendeterminingthefeasibilityof utilizingageologicunittogenerateindustrialgeothermalpower.Coresamplesfrom18wellsofthesubsurfaceJurassicSmackover FormationinsouthwestArkansaswereanalyzedattheArkansasGeologicalSurveywhereestimatedthermalconductivity,thermal gradient, andheat flowvalues were determined.Thermalconductanceof several samples was obtained usinga KD2 ProThermal Analyzeratroomtemperature.ThermalgradientswereestimatedfromSmackoverboreholetemperatures,andestimatedheatflowwascalculatedfromthermalconductanceandthermalgradientvalues.AverageestimatedthermalconductancevaluesfortheSmackoverFormationaregreatestinnortheasternLafayetteCountyat2.57WattspermeterKelvin,orW/m•K,followedbysouth- ernColumbiaandwesternCalhounCountiesat2.47W/m•Keach.NorthwesternColumbiaandnortheasternLafayetteCountiesexhibitthehighestestimatedthermalgradientandheatflowwithvaluesaveraging3.29°C/100mand63.8milliWattspermeterper meter,or mW/m2,respectively.Interpretationoftheseparameterssuggeststhatthisareaexhibitsthehighestgeothermalpotential fortheSmackoverFormationinsouthwestArkansas.InvestigationsfurthercharacterizingtheSmackoverFormation,includingin situ thermal properties and borehole temperaturemeasurements,are recommended for future geothermal feasibility studies. Introduction Worldwideinterestinrenewableenergyresourceshascreatedaneedformoredatatohelpdeterminethefeasibilityofdevelop- ingtheseenergyalternatives.Geothermalenergyisonepotentialresourcewhichiscurrentlybeingevaluatedbyeachstateinpar- ticipationwiththeStateGeothermalDataProject,acollaborativeprojectorganizedbytheAssociationofAmericanStateGeolo- gists(AASG)andfundedbytheDepartmentofEnergy(DOE).TheArizonaGeologicalSurvey,underthedirectionofLeeAllison, wasdesignatedbytheAASGtocollectandcontributedigitizedlegacygeothermaldatafromall50statestotheNationalGeother- malDataSystem(NGDS),apubliclyavailabledatabasenetwork.TheArkansasGeologicalSurvey(AGS)contributedgeothermal dataprimarilyfromtheSmackoverFormationinsouthernArkansasintheformofboreholetemperatures(BHT’s),drillerlogs,and thermalconductancemeasurements(availableathttp://services.usgin.org/track/report/AR).Observedhightemperaturedataofthe Smackover Formation prompted further investigationinto its potential as a geothermal reservoir for the state. The purposeofthisresearchistocharacterizethesubsurfacethermalconductivity, thermalgradient,andheatflowofthe SmackoverFormationasapotentialgeothermalenergyresourceinsouthwestArkansas. Thermaldatawascollectedoveratwo- year period starting in 2010. SmackoverFormationin SouthArkansas Thermal Gradientof the SmackoverFormation Thermalgradientisavectordependentontemperaturedistributedinthreedimensionswiththemaximumthermalgradientin theverticaldirectionwithintheuppercrustoftheEarth;therefore,thermalgradientissimplifiedto∆T=∂T/∂z,orchangeintem- peratureperchangeindepth(Kelvin/meters).ThermalgradientsweredeterminedforeachwellbyfirstcorrectingBHTdataforin situboreholeconditionsusingtheHarrisonCorrectionEquation(Harrisonetal.,1983).Then,∂TwascalculatedbythedifferencebetweenthecorrectedBHT’sandtheaveragesurfacetemperatureinsouthArkansasat17.2˚C(63.1˚F).∂zisthedepth,inmeters, inwhichmaximumBHT’swererecorded.Forlogsinwhichseveralrunswererecorded,consecutivecorrectedBHT’sanddepthvalueswereusedtofind∂Tand∂zvalues,respectively, where∂T/∂zwasaveragedtofind∆Tforeachwell.The(harmonic)aver- age thermal gradient estimated for southwestArkansas is 0.033 K/m (Table 2). Table2.Harrison correction(T ),correctedtemperature,estimated averagethermalgradient, andestimatedheatflowvalues(described below)forthe18Smackover wells insouthwestArkansas. Figure11.Geothermal gradient valuesforeachwell oftheSmackover Formation. RefertoFigure9forpermitnumbersandwell locations. Figure12.Estimatedgeothermal gradient rasterimageoftheSmackover Formation. GeneratedusingtheNatural Neighbor methodinSpatialAnalyst,ArcGIS10.1 Heat Flow of the SmackoverFormation Heatflow (milliWatts per meter per meter, or mW/m2), is the transfer of thermal energy from one body to another. Heatwithinthecrustisgeneratedbyeitherradioactivedecay,primarilyfromuranium,thorium,andpotassium,orthroughconductionandcon- vectionfromtheEarth’sinterior.Theconveyanceofheatthroughthecrustisprimarilyrelatedtorocktypeandstructure(Smith andFishkin,1988).Heatflow(Q)istheproductoftheaveragethermalconductivity(λavg)(Table1)andtheaveragethermalgradient (∆T) (Table 2). For southwestArkansas, the (harmonic)average heat flow is around 64 mW/m2 (Table 2). Figure 7. Drilled sample, hole filled withArcticAluminacompound for improvedthermalcontactbetweenprobe andsample. Figure 8. KD2 ProThermalAnalyzer withbetaprobe in sample.ArcticAluminagrease shown in lower right. Figure 6. Drillingofcore sample withHilti RotaryHammer. Thermal conductancevalues were corrected forin situ conditionsusing the Sekiguchi Empirical Correction Equation (1984) λ=(T0Tm)(λ – λ )(1 – 1 )+ λ T T T – T 0 m m m m 0 where λ = CorrectedThermal Conductivity λ =Thermal Conductivity at LaboratoryTemperature, T λ =1.05W/m•K, Calibration Coefficient 0 0 m T =Temperature (K) at which λwas measured (equal to initial temperatureof core sample recorded by analyzer) 0 0 T =1473 K (Calibration Coefficient) m T = BoreholeTemperature Figure2A. (A) Ooliticgrainstonesampleand(B)crysBtallinepisolitic sampleofthe upperSmackover Formation,orReynoldsoolite, southwestArkansas. A HEMPSTEAD HEMPSTEAD NEVADA NEVADA Figure 3.InformallowerSmackover Formation samples,orBrowndense,southwestArkansas. OUACHITA OUACHITA CALHOUN 24087 1.37 28301 CALHOUN 27575 26424 2.18 1.73 2.47 26677 28258 1.55 Figure 13. Estimated heat flow for each Smackover Formation well in mW/m2. Labeled according to actual heat flow values. Refer to Figure9 for permit numbersand well locations. Figure14.EstimatedheatflowrasterimageoftheSmackover Formation. GeneratedusingtheNatural Neighbor methodinSpatialAnalyst,ArcGIS10.1 1.81 18345 1.69 24227 29667 29766 COLUMBIA 28603 2.17 Discussion and Conclusion ForcomparisonofthermalconductanceresultsmeasuredattheAGS,samplesfrom2Smackoverwells,permitnumbers21661, anoolitictopisoliticcrystallinelimestoneatadepthof10,839ft(southwestLafayetteCounty),and25774,afine-grainedgrain- stoneatadepthof9,441ft(southeastColumbiaCounty),weresenttotheUniversityofNorthDakota(UND),HaroldHamm SchoolofGeologyandGeologicalEngineeringLaboratory,forthermalconductancetesting.TheUNDsamplesweremeasuredusingaPortableElectronicDividedBar(PEDB)inanisolatedsystemwithverticalheatflowataconstanttemperatureof20˚C (68˚F).Each sample was measured twice and averaged. UNDresultsforpermitnumbers21661and25774are2.91and2.47 W/m•K,respectively(±3.5%accuracy).Forthesewells,Table1showsthatUNDresultsarecomparabletotheresultsmeasuredattheAGSatsimilardepths,helpingtoverifytheAGSre- sults (corrected) as reasonable estimationsofin situ thermal conductivityof the Smackover Formation. FortheSmackoverFormation,northwesternColumbiaandnortheasternLafayetteCountiesdemonstratehighgeothermalpo- tentialexhibitingthegreatestheatflowforsouthwestArkansas,asevidencedbytheestimatedthermalpropertiesofexistingwellsforthisarea.Permitnumber24227hasthehighestthermalgradient(6.3°C/100m)alongwithamoderatethermalconductivity(2.2W/m•K), producing the highest heat flow value near 137 mW/m2. BasedonthesethermalestimationsforsouthwestArkansas,utilizingthermalresourcesfromtheSmackoverFormationinnorth- westernColumbiaandnortheasternLafayetteCountiesisthemostfeasiblelocationforfutureindustrialgeothermalpowerplants. Onlyasmallsetofwellsweresampledinthisarea;therefore,furtherin-depthinvestigationscharacterizinginsituBHT’sandther- mal properties of the Smackover Formation are recommended for future geothermal feasibility studies. Acknowledgments ThispublicationwaswrittentoprovidegeothermalresultsgeneratedbytheArkansasGeologicalSurveyfortheStateGeothermalDataProject,sponsoredbytheU.S.DepartmentofEnergyunderprimeaward numberDE-EE0002850,awardedtotheStateofArkansasundersubawardnumberAR-EE002850.IwouldliketothankCorbinCannonforhelpingtocollect,drill,andmeasurecoresamples,Jason Tipton for providing well log and core information and for assisting me in generating the raster maps, and theAGS staff for the editing of this content. References Harrison,W.E., K.V. Luza, M.LPrater, and P.K Cheung, 1983. GeothermalResourceAssessment in Oklahoma. Special Publications83-1. Oklahoma GeologicalSurvey. Nondorf, L.Thermal Conductivity,Thermal Gradient, and Heat Flow Estimations for the Smackover Formation, SouthwestArkansas. Misc. Pub 23.Arkansas GeologicalSurvey. Sekiguchi, K., 1984.AMethod for DeterminingTerrestrial Heat Flow in Oil BasinalAreas.Tectonophysics,Vol. 103, Issue 1-4, p. 67-79. Smith, D.L. and L. Fishkin. 1988. New Heat Flow Investigations inArkansas. Contributions to the Geology ofArkansas.Arkansas GeologicalCommission. Misc. Pub 18-C,V. III, p. 79-84. Vestal, J.H., 1950. Petroleum Geology of the Smackover Formation of SouthernArkansas. Information Circular 14,Arkansas GeologicalCommission. 37 p. Weeks,W.B., 1938. SouthArkansas Stratigraphywith Emphasis in the Older Coastal Plain Beds.AmAssoc Pet Geol Bull,Vol. 22, No. 8, p. 953-983. 28591 26150 Figure 1. General stratigraphic chart of the subsurface Jurassic section indicating relative stratigraphic position of the Smackover Formation in southArkansas. InsouthernArkansas,theUpperJurassic(Oxfordian,161-156Ma)SmackoverFormation,namedaftertheSmackoverField, UnionCounty,Arkansas(Figure1),wasoneofthefirstmajoroilproducingunitsinthestatecontributinghundredsofmillionsof barrels of oil andcondensateduring the1930s and1940s (Vestal,1950).The Smackover Formation is informallydivided intothe upper and lower Smackover. TheupperSmackoverFormationwasthemajorhydrocarbonproducerinsouthernArkansas,primarilyfromtheReynoldsoolite (wherepresent).Theupper sectionconsistsmostlyofa whitetobrown,porousoolitictopisoliticgrainstone withlocalinclusions ofcalcite,pyrite,anhydrite,gypsum,andlignite(Figure2).Sucrosictextureisalsocommonasasecondaryfeaturegeneratedfrom theweatheringofoolitesand/orpisolites(Vestal,1950).BrominebrinesareassociatedwiththeupperSmackoverinsouthArkan- sas. TheinformallowerSmackoveristhesourcerockforpetroleumpresentintheinformalupperSmackoveraswellassomeCreta- ceousreservoirs(Figure3).Duetothedevelopmentof new drillingtechnologies, severaloilandgascompaniesarecurrentlyex- ploringtheeconomicpotentialofthelowerSmackover,orBrowndense,asacommercialandunconventionalreservoir.Thelower section is described as an organic-rich, very dense, dark brown, very fine-grained, calcareousmudstone(Weeks, 1938). 2.47 2.57 LAFAYETTE1.86 1.58 MILLER MILLER 26489 LAFAYETTE COLUMBIA 1.86 1.90 UNION UNION 25774 21661 2.31 1.79 30929 21807 2.47 2.28 Average Thermal Conductivity(W/m K) 0 10 20 40 Miles SmackoverSampledCore 1.370 -1.580 1.581 -1.900 1.901 -2.310 2.311-2.570 0 10 20 40 Miles Figure9.Well locationsofmeasuredcore samples, labeledaccordingtopermitnumber.Apermitnumberis anumeric identifierassignedtoeachdrilled well inthe statebytheArkansas Oil andGasCommission. Figure10.Correctedthermalconductivityvaluesper well. Referto Figure9forpermitnumbersand well locations. CorrectedThermal ConductivityValues forthe 18 SmackoverWells (W/m•K) PIKE PIKE HOWARD HOWARD CLARK CLARK SEVIER SEVIER DALLAS DALLAS LINCOLN LINCOLN CLEVELAND CLEVELAND 1000 DESHA DESHA HEMPSTEAD OUACHITA 2000 NEVADA 400 HEMPSTEAD 100 2000 LITTLE RIVER CALHOUN LITTLE RIVER 3000 100 BRADLEY 0 300 0 NEVADA 300 DREW DREW 200 0 OUACHITA CALHOUN 5000 4000 0 6000 MILLER 200 5000 600 7000 BRADLEY 300 300 LAFAYETTE LAFAYETTE 6000 CHICOT 700 8000 500 400 6000 300 5000 800 6000 9000 COLUMBIA CHICOT MILLER 400 ASHLEY 7000 ASHLEY 900 1000 10000 COLUMBIA 4000 5000 UNION UNION 6000 1100 5000 11000 9000 6000 11000 600 9000 7000 4000 1200 8000 800 Structural Contours Contour Interval = 1,000 ft IsopachContours Contour Interval = 100 ft 0 10 20 40 Miles Table 1. Smackover thermalconductanceresults showing measurementID number, permit number of core, depth measured(ft), thermalconductance,or λ (initial, corrected,and averageper well), errorvalue recorded by analyzer, measurementdirection with respect to bedding (perp = perpendicular, para = parallel), and lithologic description of each sample. In order of increasing depth per well. Figure 4. Structural contours of top of Smackover Formation (modified fromVestal, 1950). Contour digitization byJasonTipton,AGS. Figure 5. Isopach contours of top of Smackover Formation (modified fromVestal, 1950). Contour digitization byJasonTipton,AGS.