Download
1 / 8
80 likes | 174 Views
Learn about False Discovery Rate (FDR) in statistical testing, controlling errors in multiple testing scenarios. Explore calculation methods, statistical issues, and recent changes in FDR computation.

E N D
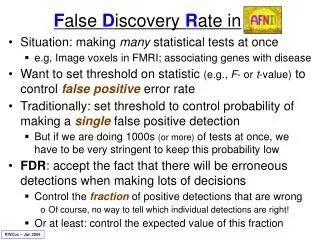
False Discovery Rate in • Situation: making many statistical tests at once • e.g, Image voxels in FMRI; associating genes with disease • Want to set threshold on statistic (e.g., F-or t-value) to control false positive error rate • Traditionally: set threshold to control probability of making a single false positive detection • But if we are doing 1000s (or more) of tests at once, we have to be very stringent to keep this probability low • FDR: accept the fact that there will be erroneous detections when making lots of decisions • Control the fraction of positive detections that are wrong • Of course, no way to tell which individual detections are right! • Or at least: control the expected value of this fraction RWCox – Jan 2008
FDR: q and z(q) • Given some collection of statistics (say, F-values from 3dDeconvolve), set a threshold h • The uncorrectedp-value of h is the probability F > h when the null hypothesis is true (no activation) • “Uncorrected” means “per-voxel” • The “corrected” p-value is the probability that any voxel is above threshold in the case that they are all unactivated • If have N voxels to test, pcorrected = 1–(1–p)N Np (for small p) • Bonferroni: to keep pcorrected< 0.05, need p < 0.05 / N, which is very tiny • The FDR q-value of h is the fraction of false positives expected when we set the threshold to h • Smaller q is “better” (more stringent = fewer false detections) • z(q) = conversion of q to Gaussian z-score: e.g, z(0.05)1.95996 • So that larger is “better” (in the same sense): e.g, z(0.01)2.57583
How q is Calculated from Data • Compute p-values of each statistic: P1, P2, P3, , PN • Sort these: P(1)P(2)P(3) P(N){subscript() sorted} • For k=1..N, q(k) = minmk [ NP(m)m] • Easily computed from sorted p-values by looping downwards from k=N to k=1 • By keeping track of voxel each P(k) came from: can put q-values (or z(q) values) back into image • This is exactly how program 3dFDR works • By keeping track of statistic value each P(k) came from: can create curve of threshold h vs. z(q) • N.B.: q-values depend on the data in all voxels, unlike these voxel-wise (uncorrected)p-values!
Graphical Calculation of q • Graph P(k) vs. k/N and draw lines from origin Real data: Full-F from speed_test2 Ideal sorted p if no true positives at all (uniform distribution) q=0.10 cutoff Slope=0.10 Very small p = very significant
Same Data: threshold F vs. z(q) z=9 is q10–19 : larger values of z aren’t useful z1.96 is q0.05; Corresponds (for this data) to F1.5
Recent Changes to 3dFDR • Don’t include voxels with p=1 (e.g., F=0), even if they are in the -mask supplied on the command line • This changes decreases N, which will decrease q and so increase z(q): recall that q(k) = minmk [ NP(m)m] • Sort with Quicksort algorithm • Faster than the bin-based sorting in the original code • Makes a big speed difference on large 1 mm3 datasets • Not much speed difference on small 3 mm3 grids, since there aren’t so many voxels to sort • Default mode of operation is ‘-new’ method • Prints a warning message to let user know things have changed from the olden days • User can use ‘-old’ method if desired
FDR curves: h vs. z(q) • 3dDeconvolve, 3dANOVAx, 3dttest, and 3dNLfim now compute FDR curves for all statistical sub-bricks and store them in output header • THD_create_all_fdrcurves(dset) does the work • 3drefit -addFDR does same for older datasets • 3drefit -unFDR can be used to delete such info • AFNI now shows p-andq-values below the threshold slider bar • Interpolates FDR curve • from header (thresholdzq)
FDR Statistical Issues • FDR is conservative (q-values are too large) when voxels are positively correlated (e.g., from spatially smoothing) • Correcting for this is not so easy, since q depends on data, so a simulation like AlphaSim is hard to conceptualize • At present, FDR is alternative way of controlling false positives, vs. clustering and AlphaSim • Working on combining FDR and clustering (e.g., Pacifico, JASA 2004) • Accuracy of FDR calculation depends on p-values being uniformly distributed under the null hypothesis • Statistic-to-p conversion should be accurate, which means that null F-distribution (say) should be correctly estimated • Serial correlation in FMRI time series means that 3dDeconvolve denominator DOF is too large • p-values will be too small, so q-values will be too small • Trial calculations show that this may not be a significant effect, compared to spatial smoothing (which tends to make q too large)