Download
1 / 35
360 likes | 485 Views
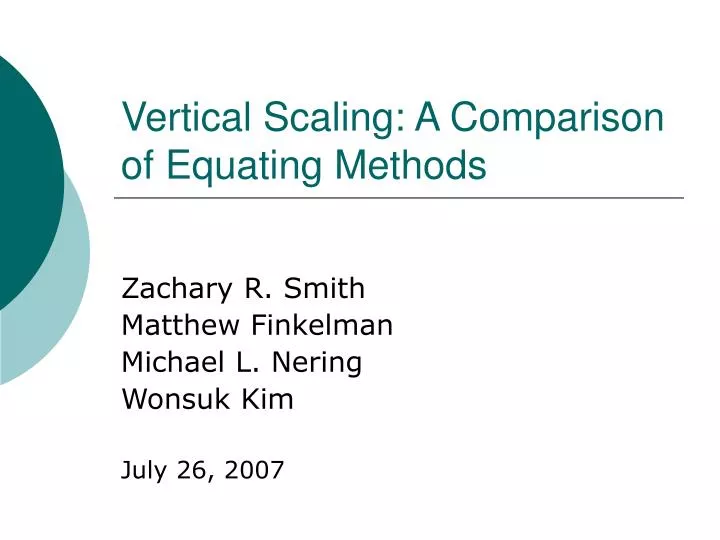
Vertical Scaling: A Comparison of Equating Methods. Zachary R. Smith Matthew Finkelman Michael L. Nering Wonsuk Kim July 26, 2007. Introduction. NCLB requires measurement of growth Vertical scaling and growth have gotten more attention in recent years with the passing of this act in 2001

E N D
Vertical Scaling: A Comparison of Equating Methods Zachary R. Smith Matthew Finkelman Michael L. Nering Wonsuk Kim July 26, 2007
Introduction • NCLB requires measurement of growth • Vertical scaling and growth have gotten more attention in recent years with the passing of this act in 2001 • Students, parents, and teachers are all interested in how much growth is achieved
Vertical Scaling • Vertical scaling puts tests with similar constructs and different difficulties onto the same scale • Controversial topic among researchers and policy-makers • Vertical scales can be sensitive and violation of assumptions can cause them to fail
Vertical Scaling Difficulties • Statistical Considerations • Sparseness in the data • Error accumulating with in the system • No specific technology around vertical scaling • Content Considerations • Unknown how the vertical scale will relate to a construct across grades • For example, elementary school science tests
Purpose of the Study • Compare 5 equating methods to determine which is best for vertical scaling • Provide guidance for researchers, practitioners, and policy-makers on the best equating method for vertical scaling • Display the severity of departures from unidimensionality
Method • Monte Carlo simulation study • 5 IRT vertical scaling transformation methods • Stocking-Lord • FCIP • Haebara • mean/mean • mean/sigma methods
Method • A vertical scale was created for grades 3 – 8 • Test consisted of 45 operational items and 15 scaling items varying in grade level with multiple forms for each grade • Grade 5 was used as the base for equating and all other grades were equated back to it
Method • We used both unidimensional and multidimensional approaches • Condition 1 – Unidimensional • Grade 5 assigned a true ability of • Other grades increased or decreased by 0.5 • Lower grades: • Upper grades:
Condition 2 - Multidimensional • Case 1 – Each examinee has a different ability dependent upon the grade level of the items they take • Theta values increased for lower grades (examinees expanded on previous knowledge and increased their ability) • Theta values decreased for upper grades (examinees have not seen this material before and their ability drops)
Condition 2 - Multidimensional • Case 2 – Each examinee has the same ability level no matter what grade level the items are • Examinees still have 3 abilities, but they are all the same • This is an experimental case that is not generalizable
Analysis • The simulation work was conducted in R • PARSCALE was used to obtain parameter estimates • STUIRT and MP programs were used to conduct the transformations • R was used for the final analysis to attain the sums of squared differences, RMSE, bias, and a percentage of examinees correctly ordered on the vertical scale
Results • Considering only the unidimensional approach, all equating gets worse the farther it gets from the base grade • This poses the question of how far is too far from the base grade for vertical scaling • All methods seem to be performing about the same, with the FCIP method slightly farther than the rest
Table 2: Average Sum of Squared Differences (Unidimensional)
Figure 1: Average Sum of Squared Differences (by grade level)
Discussion • Overall, there was a large difference between the unidimensional and multidimensional cases • Multidimensional case was far from what is expected from a good vertical scale • The two cases show different severities of how a vertical scale can fail
Discussion • Problems occurred for some of the multidimensional transformations • These only happened with the grade 8 equating, since it was farthest from the base grade, and with the Stocking-Lord procedure and Haebara method • Needs to be examined before finalizing the paper
Future Research • We would like to increase the replications to 100 to eliminate variability • More mulitdimensional cases should be added • More linking methods should be included to determine the effects of placing the base grade elsewhere
Contact Info Thank you! Zachary R. Smith zrs012@gmail.com