Download
1 / 27
270 likes | 399 Views
Lecture 34: Anthropogenic Inputs of Greenhouse Gases in the Past 200 Years. Ch. 18. Anthropogenic Inputs of Greenhouse Gases in the Past 200 Years. Chapter 18 (325-335). Greenhouse Effects and Global Warming Carbon Dioxide Where CO2 comes from? Where it is absorbed? How long it works?

E N D
Lecture 34: Anthropogenic Inputs of Greenhouse Gases in the Past 200 Years Ch. 18
Anthropogenic Inputs of Greenhouse Gases in the Past 200 Years Chapter 18 (325-335) • Greenhouse Effects and Global Warming • Carbon Dioxide • Where CO2 comes from? • Where it is absorbed? • How long it works? • How the strength of the sink responds to the CO2 rise? • Methane • Nitrous Oxide
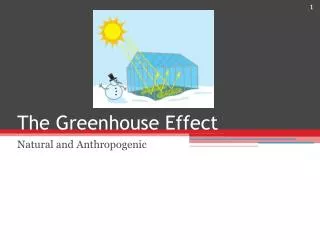
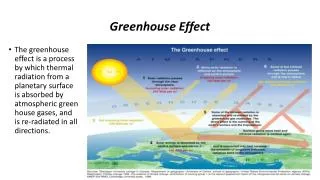
“Greenhouse Effects” • A greenhouse keeps the plants inside warm. • Greenhouse gases keep the Earth’s surface warm.
Annual Global Mean Surface Temperature and Carbon Dioxide Concentrations Global Temperature (°C) CO2 Concentration (ppmv) Measured Ice Core Data T CO2 Year
How is carbon cycled in the Earth’s climate system? • Tectonic-scale cycling: hundreds of millions of years (plate tectonics and weathering) • Orbital-scale cycling: hundreds of thousands of years (glacial and interglacial cycles) • Seasonal-scale cycling: seasonal variations (biological activity) • Human-caused (anthropogenic) trends
Icehouse – Hothouse (= Greenhouse) cycles (~ 200 million year cycles) Tectonic-scale cycling Weathering of rocks removes CO2 from the atmosphere, and volcanic-metamorphic processes restore it
Warm planets weather more rapidly, causing CO2 in atmosphere to decrease This is a “negative feedback” mechanism, which keeps the climate system in balance. Warm temperatures rapid weathering CO2 Increase CO2 reduction slow weathering Cooler Temperatures
Orbital-scale Cycling: CO2 over last 400,000 years Carbon dioxide has varied from ~ 190 – 280 ppmv. Present (in year 2006) concentration is 381 ppmv. Hypothesis: Iron enrichment of the oceans During glacial periods, more dust more iron fallout into the oceans more phytoplankton more photosynthesis lower CO2 colder climate windier more dust • Methane has varied from • ~ 350 – 800 ppbv. Present (in year 2006) concentration is 1751 ppbv.
Seasonal Cycling: Seasonal Variations • Seasonal cycle of atmospheric CO2 (Mauna Loa record) • 2. Photosynthesis takes CO2 from the atmosphere and stores it as carbon in the tissues of plants • Plants, animals, natural forest and grass fires, decaying organic matter, volcanoes, release CO2 to the atmosphere
Growth rate in 1980s = (355-340) ppmv / ( 10 years ) = 15/10 =1.5 ppmv / year The same in 1990s. • Seasonal cycle of atmospheric CO2 (Mauna Loa record) Eruption of Mt. Pinatubo in 1991 In addition to documenting the large increase in atmospheric CO2 over the last several decades, these data clearly identify the signature of the terrestrial biosphere in the annual CO2 fluctuations.
Changing Atmospheric Composition: Indicators of the Human Influence Global, well-mixed greenhouse gas (GHG) concentrations CO2 • 31% increase since 1750: Highest levels • since at least 420,000 years ago • Rate of increase unprecedented over • at least the last 20,000 years 1000 1200 1400 1600 1800 2000 Year 1000 1200 1400 1600 1800 2000 Year CH4 • Increased 150% since 1750 to its highest • levels in at least 420,000 years • Has both natural (e.g., wetland) and • human-influenced sources (e.g., landfills, • agriculture, natural gas activities) • Accounts for 20% of total GHG forcing N2O • Increased 16% since 1750 to its highest • levels in at least 1,000 years • Has both natural (e.g., soils and oceans) • and anthropogenic sources • Accounts for 6% of total GHG forcing • Halocarbons (e.g., CFCs) account for 14%
Changing Atmospheric Composition: Indicators of the Human Influence Global, well-mixed greenhouse gas (GHG) concentrations CO2 • 31% increase since 1750: Highest levels • since at least 420,000 years ago • Rate of increase unprecedented over • at least the last 20,000 years CH4 • Increased 150% since 1750 to its highest • levels in at least 420,000 years 1000 1200 1400 1600 1800 2000 Year 1000 1200 1400 1600 1800 2000 Year N2O • Increased 16% since 1750 to its highest • levels in at least 1,000 years • Has both natural (e.g., soils and oceans) • and anthropogenic sources • Accounts for 6% of total GHG forcing • Halocarbons (e.g., CFCs) account for 14%
Changing Atmospheric Composition: Indicators of the Human Influence Global, well-mixed greenhouse gas (GHG) concentrations CO2 • 31% increase since 1750: Highest levels • since at least 650,000 years ago • Rate of increase unprecedented over • at least the last 20,000 years CH4 • Increased 150% since 1750 to its highest • levels in at least 420,000 years N2O • Increased 16% since 1750 to its highest • levels in at least 1,000 years 1000 1200 1400 1600 1800 2000 Year
Growth rate in the past 250 years = (370-280)/280 = 90/280 =0.31 =31% Human Impacts on Atmospheric CO2 Pre-industrial level 275 ppmv
Greenhouse Gas Emissions per Capita USA Europe U F. USSR China Japan Canada Poland India S. Africa Mexico Australia S. Korea N. Korea Cumulative carbon dioxide emissions to the atmosphere from fossil fuel combustion and cement manufacturing in 1992
Principal Anthropogenic Sources for Methane Domesticated livestock, cultivated rice paddies, fossil fuel and biomass burning, and the mining of coal, oil and gas
Global Carbon Budget Atmosphere750 753 Global Net Primary Production and Respiration Fossil Fuel Emissions Land Use Change Ocean Surface Exchange 5.5 1.6 61.5 60 60 0.6 92 90 90 Vegetation 610 Soils 1580 Surface Ocean 1020 Fluxes in Gt C y-1 Pools in Gt C Intermediate and Deep Ocean 38,100
Where Does Carbon Go (Carbon Sink)? Human impact on global C cycle: Burning of fossil fuels, deforestation Net emissions by humans = Net changes in carbon cycle
Missing Carbon Sink • The mysterious removal of a large amount of carbon dioxide from the Earth’s atmosphere. • The missing sink has partially offset the atmospheric CO2 amount • Previous reports: • The southern oceans were a massive sink. • The CO2 sink on land in the Northern Hemisphere was entirely in North America • New findings: • The southern oceans are taking up less than previously thought • The Northern Hemisphere landmass absorbs more than previously thought • The North American sink was smaller than the earlier estimate • Questions: Where CO2 comes from, where it is absorbed? How long it works? How the strength of the sink responds to the CO2 rise? • Unraveling this mystery is important to predict future CO2 build-up and the resultant global warming. Implications for “carbon trade”.
Terrestrial Carbon Sink Why and How Long? • Human activities (fossil fuel use and land-use) perturb the carbon cycle -- increasing the atmospheric concentration of carbon dioxide • The current terrestrial carbon sink is caused by land management practices, higher carbon dioxide, nitrogen deposition and possibly recent changes in climate • This uptake by the terrestrial biosphere will not continue indefinitely. The question is when will this slow down, stop or even become a source? • Land management results in the sequestration of carbon in three main pools -- above and below ground biomass and soils
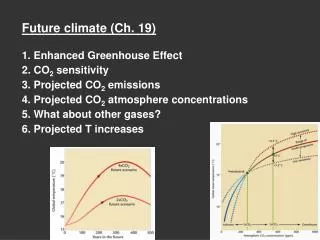
Terrestrial Biosphere predicted to take up C but will level off or reverse next century
Above-Canopy Towers for Measuring Ecosystem CO2 Exchange Towers are instrumented to measure instantaneous fluxes of CO2 to or from the forest ecosystem, using a technique called Eddy Covariance or Eddy Correlation. Summed over time, these measurements can give us daily, weekly or annual Carbon balances, to answer the question: Is the forest a source of CO2 to the atmosphere or a sink which removes CO2 from the atmosphere? What environmental factors control how much Carbon is removed?
What is Eddy Correlation? What is eddy correlation? A measurement technique for surface atmosphereexchange that makes use of turbulence and concentration measurements
3-D Sonic Anemometer Measures wind speed in 3 dimensions very rapidly (9 Hz). CO2 close to the anemometer is measured simultaneously. By noting how the CO2 concentration varies with the vertical wind speed, it is possible to calculate the CO2 flux into or out of the forest.
Ancillary Measurements Understanding CO2 Uptake/Release Automated Dendrometer Photosynthesis Soil Carbon & Litter Soil Respiration Bole Respiration