Download
1 / 48
480 likes | 615 Views
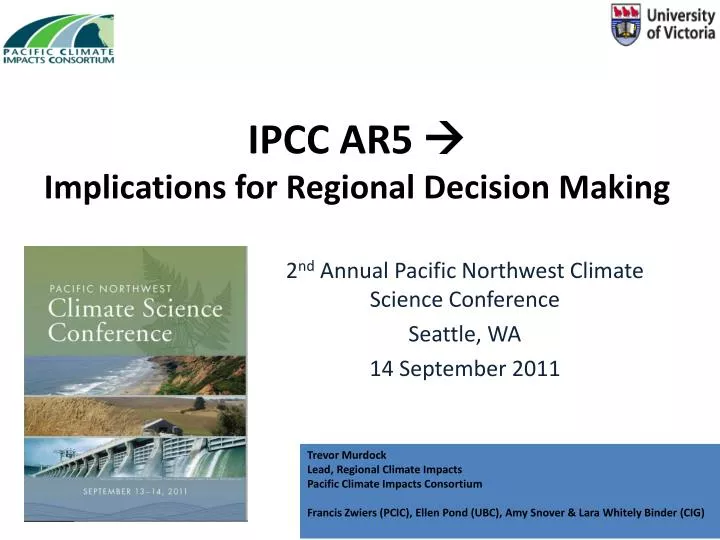
IPCC AR5 Implications for Regional Decision Making. 2 nd Annual Pacific Northwest Climate Science Conference Seattle, WA 14 September 2011. Trevor Murdock Lead, Regional Climate Impacts Pacific Climate Impacts Consortium

E N D
IPCC AR5 Implications for Regional Decision Making 2nd Annual Pacific Northwest Climate Science Conference Seattle, WA 14 September 2011 Trevor Murdock Lead, Regional Climate Impacts Pacific Climate Impacts Consortium Francis Zwiers (PCIC), Ellen Pond (UBC), Amy Snover & Lara Whitely Binder (CIG)
AR5 Timeline Fall 2013 Spring 2014 Fall 2014
Acronyms That I Will Use Freely Throughout This Talk Please raise your hand if you are unfamiliar with the term: ATIWUFTTT IPCC – Intergovernmental Panel on Climate Change FAR, SAR, TAR, AR4, AR5 – Assessment Reports CMIP – Coupled Model Intercomparison Project SRES – Special Report on Emissions Scenarios (B1, A1B, A2, A1FI, etc.) GCM – Global Climate Model RCM – Regional Climate Model ESM – Earth System Model
CMIP5: More regional, more extremes • Improved GCMs • High time resolution • + CORDEX (RCMs) • Decadal predictions IPCC AR4 Report, 2007 / UCAR / NARCCAP / Meehl et. al. 2010
AR5: More regional, more extremes • Regional atlas • Regionalphenomena chapter • Regional modellingchapter • SREX Special Report on ExtremesNov 2011 IPCC AR4 Report, 2007 / UCAR / NARCCAP / CORDEX / Schiermeier, 2011
CMIP5 & AR5: New emissions scenarios • Newest GCMs need more information • Need to go past 2100 with GCMs • Need to consider different climate policies • Need to consider adaptation Special Issue of Climatic Change. Overview: van Vuuren et. al., 2011
Representative Concentration Pathways New features • Envision stabilization in different ways • Span range of SRES and wider on low emissions end • Extension to 2300 New features • Envision stabilization in different ways • Span range of SRES and wider on low emissions end • Extension to 2300 • Concentrations vs. emissions • One to many vs. one to one relationship with IAM
Representative Concentration Pathways Attempt to spanGHGs, population, cropland, GDP,grassland, energy consumption van Vuuren et. al., 2011
Global Temperature: RCP / SRES http://www.cesm.ucar.edu/events/ws.2010/Presentations/Change/washington.pdf
Climate-GHG feedback Arora et. al., 2011: Geophysical Research Letters (38)
Scenario Planning Do Nothing – A2 8.5 Adapt to Risk – A2 8.5 Efficient Development – B1 4.5 Deep Sustainability – 2000 concentration 2.6 Do Nothing – A2 Adapt to Risk – A2 Efficient Development – B1 Deep Sustainability – 2000 concentration
Summary • AR5: more regional information and more on extremes • CMIP5 driven by new emissions scenarios Relative Concentration Pathways (RCPs) • CMIP5 models climate-GHG feedbacks • Despite CMIP5’s many improvements, CMIP3 remains a valuable source of ensembles of future climate projections
Thank you ! • More information • RCP database http://www.iiasa.ac.at/web-apps/tnt/RcpDb/dsd?Action=htmlpage&page=welcome • Moss Nature 2010http://www.nature.com/nature/journal/v463/n7282/full/nature08823.html • Integrated Assessment Modeling Consortium (IAMC) http://iamconsortium.org/ • 2011 overview article in Climatic Change special issue (van vuuren et. al.): http://www.springerlink.com/content/f296645337804p75/fulltext.html • Arora et. al., 2011: Geophysical Research Letters (38) • Acknowledgments • Francis Zwiers, PCIC, UVic • Ellen Pond, Collaborative for Advanced Landscape Planning, UBC • Amy Snover & Lara Whitely-Binder, CIG
CMIP3 GCM results driven by SRES scenarios in AR4 IPCC AR4 Figure SPM.5
Representative Concentration Pathways Integrated Assessment Modeling Consortium http://iamconsortium.org/
Summary - RCPs • Benefits: • Consistent concentrations • Comparing climate models to each other • Understanding the role of GHG/land surface feedbacks • Wide range of concentration scenarios • Flexibility in socio-economic scenarios to explain each RCP facilitate integrated impacts, adaptation, mitigation decision-making • Complicating factors: • Competing explanations for RCPs • Different emissions scenarios with and without interactive GHG/land surface feedbacks
RCPs – concentration van Vuuren et. al., 2011
Lower emissions than B1 BC Mean Annual Temperature Anomalies (from 1961-1990 baseline) UVic ESCM % reduction from 2006 levels by 2050 compared to median of AR4 GCM projections for A2, B1, and A1B (20 yr centered means) 26
RCPs: Parallel Scenario Development for IPCC AR5 Moss et al, 2010
Linked impacts, adaptation, mitigation scenarios for planning four “worlds”
Linking worlds to emissions scenarios Do Nothing Same values Adapt to Risk + Vulnerability Efficient Development Deep Sustainability
0.5°C What About the last 10 and next 20 Years?
Sources of Uncertainty [Source: Hadley Centre for Climate Prediction and Research, UK Met. Office]
Ratio of Emission Scenarios for Ensemble Average Temperature Anomalies for 2050s vs. 2080s
Linking scenarios to decision-making GB-QUEST Modelling/ Tellus regional scenarios (Carmichael)
Emissions concentrations forcing van Vuuren et. al., 2011
ECPs – extended van Vuuren et. al., 2011
CCCma ??? Similar image as this? http://www.cesm.ucar.edu/events/ws.2010/Presentations/Change/washington.pdf
RCPs – representative van Vuuren et. al., 2011
RCPs – concentration van Vuuren et. al., 2011
Representative Concentration Pathways National Geographic http://ngm.nationalgeographic.com/big-idea/05/carbon-bath