Download
1 / 42
610 likes | 1.44k Views
ANCOVA. Lecture 9 Andrew Ainsworth. What is ANCOVA?. Analysis of covariance. an extension of ANOVA in which main effects and interactions are assessed on DV scores after the DV has been adjusted for by the DV’s relationship with one or more Covariates (CVs). ANCOVA.

E N D
ANCOVA Lecture 9 Andrew Ainsworth
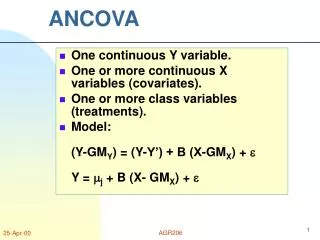
Analysis of covariance • an extension of ANOVA in which main effects and interactions are assessed on DV scores after the DV has been adjusted for by the DV’s relationship with one or more Covariates (CVs)
ANCOVA • In MR we saw this as the relationship between X1 and Y while controlling for other Xs
Basic requirements 1 DV (I, R)1 IV (N, O)1 CV (I, R)
Basic requirements • Minimum number of CVs that are uncorrelated with each other • You want a lot of adjustment with minimum loss of degrees of freedom • The change in sums of squares needs to greater than a change associated with a single degree of freedom lost for the CV
Basic requirements • CVs should also be uncorrelated with the IVs (e.g. the CV should be collected before treatment is given) in order to avoid diminishing the relationship between the IV(s) and DV.
Covariate • A covariate is a variable that is related to the DV, which you can’t manipulate, but you want to account for it in you relationship.
Applications • Three major applications • Increase test sensitivity (main effects and interactions) by using the CV(s) to account for more of the error variance therefore making the error term smaller
Applications • Adjust DV scores to what they would be if everyone scored the same on the CV(s) • This second application is used often in non-experimental situations where subjects cannot be randomly assigned
Applications • Subjects cannot be made equal through random assignment so CVs are used to adjust scores and make subjects more similar than without the CV • This second approach is often used as a way to improve on poor research designs. • This should be seen as simple descriptive model building with no causality
Applications • Realize that using CVs can adjust DV scores and show a larger effect or the CV can eliminate the effect
Applications • The third application will be addressed later in MANOVA, but is the adjustment of a DV for other DVs taken as CVs.
Unequal sample sizes, missing data, and number of cases • Missing data and unequal sample sizes can be two different entities or seen as the same idea • If data was collected with equal samples sizes planned and there is data missing on the CV or DV then this can be seen as a missing data problem
Unequal sample sizes, missing data, and number of cases • If data is unequal because of some reason (e.g. larger population of certain type of subject) then this isn’t missing data and needs to be dealt with appropriately
Unequal sample sizes, missing data, and number of cases • The problem here is that with unequal samples it is unclear how to calculate the marginal mean. • Is it the mean of the group means or the mean of the scores? • Another problem is that the variances then start to overlap one another forcing the within plus between variances to be larger than the total variance.
Unequal sample sizes, missing data, and number of cases • Listwise deletion to balance cells is an option, but a bad one. You’ll lose too much data
Unequal sample sizes, missing data, and number of cases • Change the types of Sums of squares you use • Type 3 sums of square (SSTYPE3 in GLM or method=unique in MANOVA) is the default in SPSS and assumes that the data was supposed to be complete and the difference in the number of subjects is not meaningful • Acts like standard multiple regression. Each main effect and interaction is assessed after all other main effects, interactions and covariates are controlled for • Treats all groups the same – small group is weighted equally as a large group (sometimes called the unweighted approach)
Unequal sample sizes, missing data, and number of cases • Type 1 sums of squares (SSTYPE1 in GLM or method = experimental in MANOVA) assumes that the difference in number of subjects is meaningful and gives more weight to the values from larger groups
Unequal sample sizes, missing data, and number of cases • Number of cases required depends on the number needed to reach appropriate level of power (http://www.stat.uiowa.edu/~rlenth/Power/)
Outliers • No outliers – you need to test for univariate outliers on the DV and all of the CVs individually and for multivariate outliers in the combined DV and CVs space.
No Multicollinearity/Singularity • If a CV is highly related to another CV (at a correlation of .5 or more) than it will not adjust the DV over and above the other CV. • One or the other should be removed since they are statistically redundant.
Normality of Sampling Distribution • it is assumed that the sampling distribution of means is normal. • This cannot be shown unless you take multiple samples and form sampling distribution. • It is assumed normal when the error has degrees of freedom of 20 or more (central limit theorem)
Homogeneity of Variance • Equal variances on the DV across all of the levels of the IV(s) and the CV(s). • This is most important after adjustments have been made, but if you have it before adjustment you are likely to have it afterwards.
Homogeneity of Variance • If CV or IV fail this test a more stringent alpha can be used (.01) or drop the variable from the analysis. • Tested by Levene’s test of equality of error variances, but this is a very conservative test so evaluate at probability greater than .001. If it fails at this level test with Fmax test (largest variance/smallest variance <= 10)
Linearity • is assumed that each CV has a linear relationship with the DV and other CVs
Homogeneity of Regression • the slope of the line predicting the DV from the CV should be the same for each level of the IV. • In other words the regression coefficient (B) relating a CV to the DV should be the same for each group. • In still other words, this means no IV by DV interaction
Reliability of Covariates • it is assumed that each CV is measured without error (this is unrealistic). • So it is recommended that CVs only be used when they meet a reliability of .8 or more (not very realistic either).
Equations • Just like in ANOVA the total variance can be separated into within and between groups variance:
Equations • But in ANCOVA you also have a partitioning of the variance in each CV:
Equations • And also a partitioning of the covariation between them:
This covariation is used to adjust the between and within groups sums of squares: Equations
Equations • The adjustment made to the between group scores above can also be conceptualized as the adjustment is obtained by taking each individuals deviation around Y grand mean (before adjustment) and subtracting from it each persons deviation around the Z grand mean weighted by the relationship between the two:
Equations • Each regression coefficient we need to estimate (one for every CV) eats up a degree of freedom. This accounts for the smaller error degrees of freedom when compared to regular ANOVA.
Equations • Hand computation formulas are available on page 286 in the T and F book. • An analysis of variance is then performed on the adjusted scores • Any significant findings need to be followed up with either planned or post hoc comparisons.
Equations • Percent of variance accounted for can be found for cases with one IV: • where is the adjusted total
Equations • Can be found in factorial designs by: • or
Evaluating Covariates • Each ANCOVA test also gives you a test of whether the covariate is doing an adequate job of adjusting the DV scores • Usually in the form of an ANOVA table where significant F values for the CV indicate significant adjustment
Alternatives to ANCOVA • Test of difference scores • If the CV and DV are the same but just collected at different times (e.g. pre/post design) the you are interested in change • Find the difference between the two and use that as the DV in an ANOVA
Alternatives to ANCOVA • Block designs • You use what could be a CV to match people • Then run an with a matched blocks design.