Download

1 / 23
230 likes | 363 Views
Mean, Median, Mode, 5 number Summary, and Center of Dispersion. Decide if it’s a permutation or a combination, then find how many are possible:

E N D
Mean, Median, Mode, 5 number Summary, and Center of Dispersion
Decide if it’s a permutation or a combination, then find how many are possible: • Your class is having an election. There are 7 candidates, and they are each running for president, vice president, secretary, and treasurer. How many different executive boards are possible? • The 3 students who did not win office decided to run for representative with 12 other students. If there are 10 representative positions available, how many different student councils are possible? Warm Up
Another word for average Also called “x-bar” (especially when we talk about statistics) You find this by adding up all the numerical data in a set and dividing it by the number of data entries in the set Mean
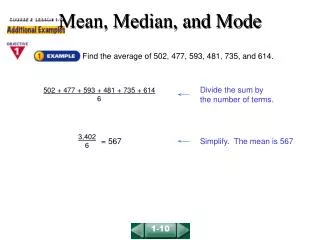
Find the Mean for the following set: • 48, 23, 97, 36, 27, 72, 48, 41, 58 • 48+23+97+36+27+72+48+41+58=450 • 450/9=50, so 50 is the mean Example
Find x bar for the following set: 420, 360, 398, 196, 398, 400 iRespond Question Multiple Choice F A.) 300 B.) 312 C.) 362 D.) 398 E.) 400
After numbers are written in numerical order, the median is the middle number • Does it matter if the numbers increase or decrease? • We normally write them in increasing order, but it doesn’t actually matter Median
Find the median of this set: • 48, 23, 97, 36, 27, 72, 48, 41, 58 • Remember the first step is to list in order: • 23, 27, 36, 41, 48, 48, 58, 72, 97 • There are 9 numbers, so the 5th number is the middle: 48 is the median Ex
Find the median of the set: 420, 360, 398, 196, 398, 400 iRespond Question Multiple Choice F 00:00:28 A.) 360 B.) 362 C.) 196 D.) 400 E.) 398
The most frequent number or numbers There can be no mode There can be multiple modes Mode
Find the mode of this set of data 48, 23, 97, 36, 27, 72, 48, 41, 58 The only repeated number is 48, so this must be the mode! EX
Find the mode: • 4, 9, 2, 5, 10, 7, 1, 8, 3, 6 • Since no number is repeated, there is no mode EX
Find the mode or modes, if any: 420, 360, 398, 196, 398, 400 iRespond Question Multiple Choice F A.) 420 B.) 398 C.) 360 D.) 400 and 298 are both modes E.) No mode
The 5 number summary describes the minimum, the maximum, Q1, the median (or Q2), and Q3 What is all this Q stuff? 5 Number Summary
When I say Q1, I mean Quartile 1 • What does quartile sound like? • Quarter- when we split up a data set into 4 parts, we have 4 quarters. The separating number is call the quartile. • Q2 is the median of the set • Q1 is the median of the 1st half of the set • Q3 is the median of the 2nd half of the set Quartiles
Given the set 4, 9, 2, 5, 10, 7, 1, 8, 3, 6 • The first step is to write them in order • The next step is to find the median, This is Q2 • Because it falls between 2 numbers, the median is the average of 5 and 6. • Next find the median of each side of the median • Identify the min and max • Lastly list the minimum, Q1, Q2,Q3, and the maximum to get the 5 number summary • 1, 3, 5.5, 8, 10 Here’s how it works Q2 MIN Q1 Q3 MAX 5.5 1 2 3 4 5 6 7 8 9 10 |
Find the 5 number summary for the set: 420, 360, 398, 196, 398, 400 196, 360, 398, 398, 400, 420 iRespond Question Multiple Choice F A.) 420, 398, 398, 360 196 B.) 196,360, 398, 398, 400 C.) 420, 400, 398, 196 D.) 196, 360, 398, 400, 420 E.) 196, 420
Box and whisker plot Take the set of data from the last example, and look at the 5 number summary: 1, 3, 5.5, 8, 10 On a number line, plot these 5 numbers Draw a box around Q1 and Q3 Draw a line through Q2 Draw lines connecting the min to Q1 and the max to Q3 What do we do with the 5 number Summary? MAX MIN Q1 Q2 Q3
Also called range • It is the difference between the minimum and the maximum. (always positive!) • In our set of data the min was 1 and the max was 10 • The difference is 10-1=9, so our range is 9 Measure of Dispersion
IQR The difference between Q3 and Q1 In our set 3 was Q1 and 8 was Q3, so the IQR=8-3=5 This will always be a positive number!! Interquartile Range
Find the range of the data set: 420, 360, 398, 196, 398, 400 iRespond Question Multiple Choice F A.) 224 B.) 200 C.) 400 D.) 196 E.) 38
Find the IQR for the following data set: 420, 360, 398, 196, 398, 400 iRespond Question Multiple Choice F A.) 420 B.) 40 C.) 38 D.) 224 E.) 196