Download
1 / 14
250 likes | 497 Views
Mean, Median, Mode. Section 1-6. Notes. Measures of central tendency are ways to understand the trend of the data by looking at different measures of the center. Notes. Outlier – A Piece of data that is far outside the normal range of data.

E N D
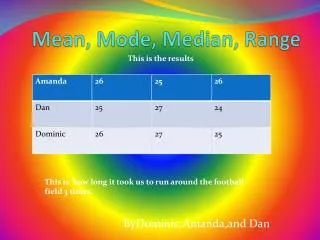
Mean, Median, Mode Section 1-6
Notes • Measures of central tendency are ways to understand the trend of the data by looking at different measures of the center.
Notes • Outlier – A Piece of data that is far outside the normal range of data. • Example: If we were measuring class heights who would be an outlier?
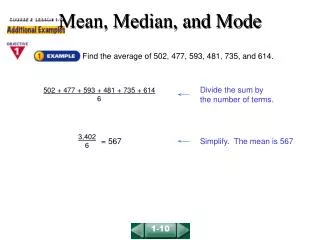
Notes • The mean or average is the sum of the data divided by the amount of data. • It can be affected by outliers
Notes • The median is the middle number of a set of data. It is not affected by outliers. The data must be in order. • When finding the median of a data set with an even amount of numbers, take the average of the inner two numbers.
Notes • The mode is the most often used number. • Range is the difference between the largest and smallest set of data.
Activity • We will find the height of all the students in class. • When you have your height please write it on the board and then copy the number is your notes. • We will use height again so please don’t forget.
Activity • Now let’s find the mean, median, and mode for our data. • Next let’s find the range.
Notes • The median divides data in half, let’s find the median of the lower half and the upper half. • The median of the lower half is called Q1 and the median of the upper half is called Q3
Notes • The five number summary is • Minimum • Q1 • Median • Q3 • Maximum
Notes • Stem and Leaf Plots
Notes • Stem and Leaf Plots
#5 pg. 43 • Write and solve an equation to find the value of x. • 3.8, 4.2, 5.3, x; mean 4.8