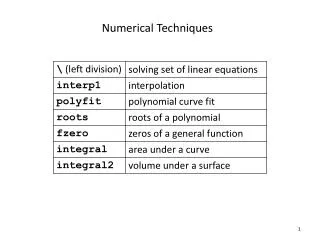
Download
1 / 80
800 likes | 1.01k Views
Numerical Descriptive Techniques. Chapter 4. 4.2 Measures of Central Location . Usually, we focus our attention on two types of measures when describing population characteristics: Central location (e.g. average) Variability or spread.

E N D
Numerical Descriptive Techniques Chapter 4
4.2 Measures of Central Location • Usually, we focus our attention on two types of measures when describing population characteristics: • Central location (e.g. average) • Variability or spread The measure of central location reflects the locations of all the actual data points.
統計學用來衡量資料特性的統計測量數: 1. 中央趨勢(Central location) 2. 分散度(Variability)
中央趨勢的衡量 主要表示資料分配的中心位置或資料的共同趨勢。用來表示資料的中央趨勢之測量數,主要有三種: 1.平均數(mean) 2.中位數(median) 3.眾數(mode)
With one data point clearly the central location is at the point itself. 4.2 Measures of Central Location • The measure of central location reflects the locations of all the actual data points. • How? With two data points, the central location should fall in the middle between them (in order to reflect the location of both of them). But if the third data point appears on the left hand-side of the midrange, it should “pull” the central location to the left.
Sum of the observations Number of observations Mean = The Arithmetic Mean • This is the most popular and useful measure of central location
The Arithmetic Mean Sample mean Population mean Sample size Population size
Example 4.2 Suppose the telephone bills of Example 2.1 represent the populationof measurements. The population mean is The arithmetic mean The Arithmetic Mean • Example 4.1 The reported time on the Internet of 10 adults are 0, 7, 12, 5, 33, 14, 8, 0, 9, 22 hours. Find the mean time on the Internet. 0 7 22 11.0 42.19 38.45 45.77 43.59
平均數(算術平均數) 1.所有觀測值的總和除以觀測值的個數 2.算術平均數是資料的平均數點 3.優點:使用所有(每一個)的數據 缺點:易受極端值的影響
例子: 郭董:”林小姐(會計),請您算一下並告訴我我們公司全體員工的平均的月薪。謝謝!”林小姐面帶微笑的回答:”請等一下,我來算一算。”(半小時以後)王小姐:”報告總經理,我們公司的平均月薪是新台幣35,660元。” 郭董:”很好,現在的企業這麼難經營,本公司有有這麼好的薪資,算起來很不錯。大家努力幹,公司不會虧待大家!”
林小姐面上仍然個持微笑,但心裡想:”見你的鬼,該好好幹的是你,公司沒虧待的也只有你一個。”林小姐面上仍然個持微笑,但心裡想:”見你的鬼,該好好幹的是你,公司沒虧待的也只有你一個。” 各位,一個小公司平均月薪35,600元算起來還不壞啊。林小姐幹麼不高興呢?她已幹了3年的會計,但是現在的薪水才22,500元。原來公司的十五個員工的薪資是這樣的: 14,500: 15,000: 16,000: 16,500: 17,000: 17,900: 18,500: 19,000: 21,000: 22,500: 25,000: 30,000: 35,000 250,000(郭董)
Example 4.3 Find the median of the time on the internetfor the 10 adults of example 4.1 Suppose only 9 adults were sampled (exclude, say, the longest time (33)) Comment Even number of observations 0, 0, 5, 7, 8,9, 12, 14, 22, 33 The Median(中位數) • The Median of a set of observations is the value that falls in the middle when the observations are arranged in order of magnitude. Odd number of observations 8 8.5, 0, 0, 5, 7, 89, 12, 14, 22 0, 0, 5, 7, 8,9, 12, 14, 22, 33
中位數 搜集得來的資料經順序排列後,居於數列中央的那一個數值,那是中位數 (1)N為奇數:中位數位於數列中的第(N+1)/2位。 (2)N為偶數:則可取前後兩個數之平均數。 在所有觀察值中至少有一半(50%)的數值大於等於該數值或至少有一半(50%)的數值小於等於該數值。 不受極端值之影響,可是不易進行統計推論。
The Mode(眾數) • The Mode of a set of observations is the value that occurs most frequently. • Set of data may have one mode (or modal class), or two or more modes. For large data sets the modal class is much more relevant than a single-value mode. The modal class
The Mode The Mean, Median, Mode The Mode • Example 4.5Find the mode for the data in Example 4.1. Here are the data again: 0, 7, 12, 5, 33, 14, 8, 0, 9, 22 Solution • All observation except “0” occur once. There are two “0”. Thus, the mode is zero. • Is this a good measure of central location? • The value “0” does not reside at the center of this set(compare with the mean = 11.0 and the mode = 8.5).
眾數 指資料內的觀察值中發生次數最多的那一個數值。 不受極端值之影響;可能有多個或沒有;對觀察值的個數或數值變化的感應不靈敏。
Relationship among Mean, Median, and Mode • If a distribution is symmetrical, the mean, median and mode coincide • If a distribution is asymmetrical, and skewed to the left or to the right, the three measures differ. A positively skewed distribution (“skewed to the right”) Mode Mean Median
Relationship among Mean, Median, and Mode • If a distribution is symmetrical, the mean, median and mode coincide • If a distribution is non symmetrical, and skewed to the left or to the right, the three measures differ. A negatively skewed distribution (“skewed to the left”) A positively skewed distribution (“skewed to the right”) Mode Mean Mean Mode Median Median
中央趨勢各統計量數之比較與選擇: 1.名義(類別)尺度:眾數 2.順序尺度:眾數、中位數 3.區間尺度:平均數、中位數、及眾 數均可 4.單一測量數不能清楚說明或難區分 時,可以同時採取多個測量數。
4.3 Measures of variability • Measures of central location fail to tell the whole story about the distribution. • A question of interest still remains unanswered: How much are the observations spread out around the mean value?
4.3 Measures of variability Observe two hypothetical data sets: Small variability The average value provides a good representation of the observations in the data set. This data set is now changing to...
4.3 Measures of variability Observe two hypothetical data sets: Small variability The average value provides a good representation of the observations in the data set. Larger variability The same average value does not provide as good representation of the observations in the data set as before.
由平均數、中位數與眾數可了解資料的中央趨勢,若有二組資料,其中央趨勢相同,我們要比較這兩組資料呢?由平均數、中位數與眾數可了解資料的中央趨勢,若有二組資料,其中央趨勢相同,我們要比較這兩組資料呢? ANS:可進一步比較這兩組資料的分散程度差異的大小。 分散程度的比較有時比中央趨勢(Mean)的比較來得更重要。 分散程度或變異性(Variability)的計算- ---根據平均數、中位數或眾數為中心,通常是以平均數來衡量觀測值的分散程度。
分散程度或變異性(Variability) Small variability Larger variability
分散程度的衡量 1.全距(Range) 2.變異數(Variance) 3.標準差(Standard Deviation) 4.變異係數(Coefficient of Variance )(CV)
? ? ? The range • The range of a set of observations is the difference between the largest and smallest observations. • Its major advantage is the ease with which it can be computed. • Its major shortcoming is its failure to provide information on the dispersion of the observations between the two end points. But, how do all the observations spread out? The range cannot assist in answering this question Range Largest observation Smallest observation
全距 1. R=最大值-最小值 2.以資料頭尾兩者相差的大小衡量整 個分散度。 3.一般R愈大,表示分散程度愈大, 可是它只考慮最大與最小兩個觀察 值並未考慮所有的觀察值,故不能 精確的反應與描述所觀察的整體。
This measure reflects the dispersion of all the observations • The variance of a population of size N x1, x2,…,xN whose mean is m is defined as • The variance of a sample of n observationsx1, x2, …,xn whose mean is is defined as The Variance
Sum = 0 Sum = 0 Why not use the sum of deviations? Consider two small populations: 9-10= -1 A measure of dispersion Should agrees with this observation. 11-10= +1 Can the sum of deviations Be a good measure of dispersion? The sum of deviations is zero for both populations, therefore, is not a good measure of dispersion. 8-10= -2 A 12-10= +2 8 9 10 11 12 …but measurements in B are more dispersed then those in A. The mean of both populations is 10... 4-10 = - 6 16-10 = +6 B 7-10 = -3 13-10 = +3 4 7 10 13 16
The Variance Let us calculate the variance of the two populations Why is the variance defined as the average squared deviation? Why not use the sum of squared deviations as a measure of variation instead? After all, the sum of squared deviations increases in magnitude when the variation of a data set increases!!
The Variance Let us calculate the sum of squared deviations for both data sets Which data set has a larger dispersion? Data set B is more dispersed around the mean A B 1 2 3 1 3 5
SumA = (1-2)2 +…+(1-2)2 +(3-2)2 +… +(3-2)2= 10 SumB = (1-3)2 + (5-3)2 = 8 The Variance SumA > SumB. This is inconsistent with the observation that set B is more dispersed. A B 1 3 1 2 3 5
The Variance However, when calculated on “per observation” basis (variance), the data set dispersions are properly ranked. sA2 = SumA/N = 10/5 = 2 sB2 = SumB/N = 8/2 = 4 A B 1 3 1 2 3 5
The Variance • Example 4.7 • The following sample consists of the number of jobs six students applied for: 17, 15, 23, 7, 9, 13. Finds its mean and variance • Solution
變異數Variance 1.變異數的值必≧零;若為零,表示所有的觀測數值均相同。 2.適合進行統計推論工作。 3.變異數之單位為觀測數值單位的平方,具有複名數,不具統計意義,不易解釋。
2 s Standard Deviation (SD,標準 偏 差 ) • The standard deviation of a set of observations is the square root of the variance . = Sample standard deviation : SD 2 s = s Population st andard deviation :
Standard Deviation • Example 4.8 • To examine the consistency of shots for a new innovative golf club, a golfer was asked to hit 150 shots, 75 with a currently used (7-iron) club, and 75 with the new club. • The distances were recorded. • Which 7-iron is more consistent?
Standard Deviation • Example 4.8 – solution Excel printout, from the “Descriptive Statistics” sub-menu. The innovation club is more consistent, and because the means are close, is considered a better club
標準差 1.標準差是將變異數開根號。 由於變異數的名數為複名數,不易解 釋,為除去該缺點,將變異數開根號所 得的稱為標準差。 2.標準差的衡單位與原始資差無異。 3.變異數與標準差是測量資料分散程度 ,比較良好且是最常用的統計測量測 量數。
Interpreting Standard Deviation • The standard deviation can be used to • compare the variability of several distributions • make a statement about the general shape of a distribution. • The empirical rule: If a sample of observations has a mound-shaped distribution, the interval
Interpreting Standard Deviation • Example 4.9A statistics practitioner wants to describe the way returns on investment are distributed. • The mean return = 10% • The standard deviation of the return = 8% • The histogram is bell shaped.
Interpreting Standard Deviation Example 4.9 – solution • The empirical rule can be applied (bell shaped histogram) • Describing the return distribution • Approximately 68% of the returns lie between 2% and 18% [10 – 1(8), 10 + 1(8)] • Approximately 95% of the returns lie between -6% and 26% [10 – 2(8), 10 + 2(8)] • Approximately 99.7% of the returns lie between -14% and 34% [10 – 3(8), 10 + 3(8)]
經驗法則 若資料的分配呈現常態峰則或鐘型分配。 1.約有68%的資料落入一個標準差之內。 2.約有95%的資料落入二個標準差之內。 3.約有99.7%的資料落入三個標準差之內。
The Coefficient of Variation變異係數(CV) • The coefficient of variation of a set of measurements is the standard deviation divided by the mean value. • This coefficient provides a proportionate measure of variation. A standard deviation of 10 may be perceived large when the mean value is 100, but only moderately large when the mean value is 500
衡量相對分散度的變異係數(CV) CV =標準差 / 平均數 變異係數-標準差除以平均數的目的表達相對的變動情形。 測量分散程度的統計測量數 如全距,變異數與標準差,均只能衡量資料的絕對分散程度。 若有二組資料,而欲比較其分散程度,變異數與標準差會受到平均數大小不同以及不同測量單位的影響。
現假設 A公司83年營業收益中,其平均數為3371萬元,標準差為383萬元。變異係數為: B公司83年營業收益中,其平均數為6000萬元,標準差為400萬元 比較其營業額的相對分散情形何者較穩定? B公司的營業額的標準差雖較大,但其平均營業額為6000萬元,較A公司大得多,兩公司的規模顯然不同。因此,為比較其營業額的相對分散情形,必須利用變異係數來比較。B的變異係數為400/6000=0.0667小於A公司的變異係數。由此可知,B公司的營業收益分散程度相對較小,83年12個月營業收益相對A公司而言較穩定,變化較少。
Your score 4.4 Measures of Relative Standing and Box Plots • Percentile • The pth percentile of a set of measurements is the value for which • p percent of the observations are less than that value • 100(1-p) percent of all the observations are greater than that value. • Example • Suppose your score is the 60% percentile of a SAT test. Then 40% 60% of all the scores lie here
Quartiles • Commonly used percentiles • First (lower)decile = 10th percentile • First (lower) quartile, Q1, = 25th percentile • Second (middle)quartile,Q2, = 50th percentile • Third quartile, Q3, = 75th percentile • Ninth (upper)decile = 90th percentile
Quartiles • Example Find the quartiles of the following set of measurements 7, 8, 12, 17, 29, 18, 4, 27, 30, 2, 4, 10, 21, 5, 8