Download
1 / 22
220 likes | 322 Views
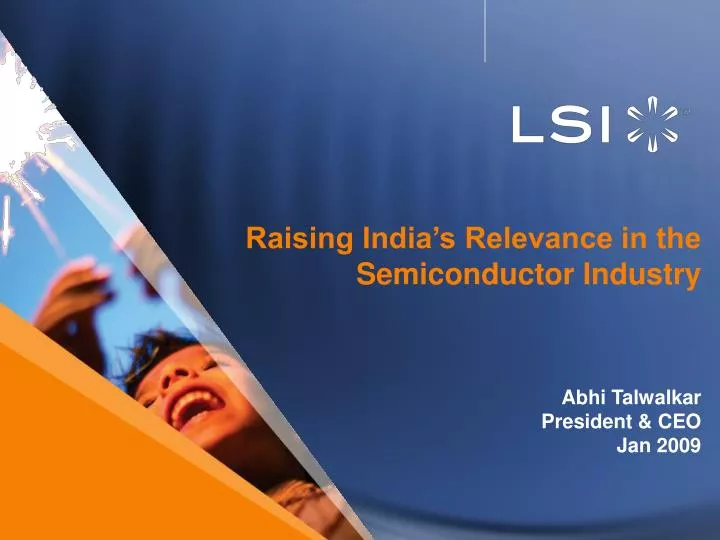
Raising India’s Relevance in the Semiconductor Industry Abhi Talwalkar President & CEO Jan 2009. LSI Mission: To be the most trusted provider of technologies that connect people and information. LSI Corporation. LSI Proprietary. 2. India Must Cultivate These Enablers. Key Messages.

E N D
Raising India’s Relevance in the Semiconductor IndustryAbhi TalwalkarPresident & CEOJan 2009
LSI Mission: To be the most trusted provider of technologies that connect people and information LSI Corporation LSI Proprietary 2
India Must Cultivate These Enablers Key Messages • The worldwide semiconductor industry is $250B+ and growing • Market forces over time have driven structural changes creating sub-industries and many new opportunities • India has benefited through increasing participation and growing contribution over the past 10 years • India possesses a unique combination of intrinsic enablers that can greatly elevate its role into the future 3
China: 1% Taiwan: 6% Regional Semiconductor Revenues (%, 2007)** South Korea: 11% Worldwide Semiconductor Sales ($B)* 300 EMEA: 12% Americas: 48% 250 Japan: 21% 200 150 Other Asia Pacific: 9% Regional Semiconductor Consumption (%, 2007)** Taiwan: 4% 100 South Korea: 7% Americas: 19% 50 EMEA: 14% India: 1% China/Hong Kong: 33% 0 Japan: 13% 1994 1996 1998 2000 2002 2004 2006 2008 Semiconductor Industry Growth *Global Semiconductor Association, Dec 2008 **Gartner WW Semiconductor Forecast, Nov 2008 4
Vertically Integrated Companies Assembly, Test & Fulfillment Backend Productization Competition Economics Standardization Talent Access Market Access CAD Industry Fabless IC Companies Assembly & Test Foundry Industry 3rd Party Design Chip Design Circuit Design/IP Development Design Tools Si Technology & Manufacturing Off Shoring Vertically Integrated Co’s 1980s to Early 1990s Transformation New Opportunities, Industries, & Players A Horizontal Industry Late 1990s to 2000s 5
2007: $53.1 2006: $49.6 Total Public Fabless Revenue by Year ($billion)* 2005: $39 2004: $33.4 2003: $22.3 2000: $17 2002: $14.6 2001: $13.3 1999: $10.2 2006:1,350 2008:1,340 2005:1,300 2007:1,300 Growth of Fabless Companies Worldwide* 2004:1,250 2003:1,100 2002:950 2001:850 2000:750 1999:500 Dawn of Foundries Dawn of Fabless IC Companies *Global Semiconductor Association, Dec 2008 6
• Israel: 61 Worldwide Distribution of Fabless IC Companies • Asia 510 China: 222 Taiwan: 196 Korea: 47 Japan: 16 Hong Kong: 16 Singapore: 7 Malaysia: 4 India: 2-28* • Canada: 29 • Europe: 151 • USA: 606 *Fabless Companies = 2 Design Services/IP Providers = 28 Global Semiconductor Association, Dec 2008 7
CAD Industry 3rd Party Design/IP Houses Assembly and Test Fabless IC Companies Foundry Industry Off Shoring India Growing in Participation
Revenues for VLSI, Board Design and Embedded Software, 2007-2010* Workforce for VLSI, Board Design and Embedded Software, 2007-2010* 12 250,000 (US$ billion) 10 200,000 8 150,000 6 100,000 4 50,000 2 $6.08B $7.37B $8.97B $10.96B 130,000 153,000 183,000 219,000 0 0 2007 2008 2009 2010 2007 2008 2009 2010 India Growing in Participation *ISA-IDC Report 2008: India Semiconductor and Embedded Design Service Industry
700+ SoCs - Architecture 550 SoCs - Architecture Systems - Architecture Systems - Architecture 400 VLSI - End-to-End Systems - MicroArch Development Functions VLSI - Design - Verification - Phy Design - Si Validation 250 VLSI - Design - Verification - Phy Design VLSI - Design - Verification Software - End-to-End 100 Software - Firmware - Drivers - Application - QA Software - Drivers - Application - QA Software - Application - QA Software - Application - QA Time LSI India Growth in Numbers and Capability
3 2 1 1 2 1 1 3 3 2 1+ 1 2 2 2 2 1 2 2 2 SystemsMfg. ODMs, Foundries Mfg., Memories Consumer Electronics Software High quality, scalable & cost effective talent Emergence of sizable local market Local presence of systems companies Culture of innovation Necessary Enablers to Grow India’s Relevance India’s Intrinsic Enablers
Availability Scalability Relevance Quality Cost Retention Talent is Key Ingredient for Growth
Engineering Workforce Break-up by Educational Qualification India, 2007* Current Availability & Supply of Talent* 150,000 China India Diploma Holders: 4.9% 100,000 Others: 2.8% Taiwan Number of degrees awarded per year PhD: 1.1% Czech Rep. 50,000 USA UK Israel Canada 0 100,000 200,000 300,000 Masters Degree: 24.6% Current size of relevant engineering pool in semiconductor design Annual Indicative Engineering Salary ($)** Bachelors in Engineering: 66.6% $100,000 $80,000 $60,000 $40,000 $20,000 India China S. Korea Taiwan USA Japan India Compares Favorably in Availability of Talent *ISA - Ernst & Yong Benchmarking Study: India in the Global Semi Design Ecosystem, Feb 2007 **Radford Benchmark and International Survey 2007 13
Grow India’s end-to-end capability • Dedicated in-house training • Build strong pipelines: University collaborations/sponsorships/internships Industry • Build relevant university curriculum • Facilitate labs and training facilities • Incentivise faculty Academia Nurturing Talent is a Collective Responsibility
Growing per capita income • Rise in household spending Consumer Electronics • Telecom services - mobile and fixed line • SPs investing in building infrastructure • Deregulation of satellite/cable industry Communications Equipment • Growing popularity of PCs • Affordability is the key Data Processing Hardware • Automotive: Emissions and Safety • Industrial: Mfg Systems and Medical Equip. Automotive/Industrial Growing GDP Offering an Attractive Local Market
PC Unit Shipments Comparison (2012)** Share of Total Electronics Demand by Application Category, India, 2006 and 2011* 100 80 80 11% (US$billion) 60 Unit Shipments (M) 18% 60 40 CAGR=21.5% 20 40 38% 0 75 8% Taiwan S. Korea Japan India China W. Europe USA 17% 20 Mobile Handset Unit Shipments Comparison (2012)*** 36% 28 33% 1,600 39% 0 1,200 2006 2011 Unit Shipments (M) 800 400 Consumer electronics Communication electronics • Includes industrial, automotive and military/civil aerospace products • CAGR=compound annual growth rate Data processing electronics Other electronics* 0 Japan W. Europe India Taiwan S. Korea USA China Rapid Growth Expected in Semiconductor Consumption *Dataquest Insight: Demand for Electronic Equipment, India: 2006-2011, August 2007 **Gartner Dataquest Market Statistics: Forecast PCs, September 2008 ***Gartner Dataquest Market Statistics: Forecast Mobile Handsets, September 2008
Increasing Local Investments by Systems Companies Manufacturing Investments by Top Global OEMs* Products OEM Investment ($million) *Market Trends: India's Twin Benefits for Global EMS Vendors, Gartner Report August 2007
Not cost effective to import • Complex customs and import duties • Weak logistics infrastructure Weak Supply Base of Other Components • Lack of scale • Must provide value added services Limited Market Size Weak Infrastructure and Logistics Facilities • Power, water, transportation networks Challenges Remain to Large Scale OEM Investments
Total Patent Applications Total PatentsGranted • Increasing system level know how will enable greater innovation • There must be a commitment to invest in basic research • Innovation is cultural, great minds will generate great ideas India Must Extend Innovation to Product Development Patents Applied For and Granted by Country (2001-2005)* *ISA- Ernst & Yong Benchmarking Study: India in the Global Semi Design Ecosystem, Feb 2007 19
1876: First Telephone 2007: Industry’s First 65nm Iterative DecodingRead Channels 1948: Information Theory 1999: Raman Amplifier Created 1969: Developed UNIXOperating System 1958: Patent on Laser 1979: First Digital SignalProcessor (DSP) 1960: First SCSI Protocol chip 1989: First All-ASIC Workstation 1926: Sound Movies 1947: Developed First Transistor 1994: Sony PlayStationIntroduced Using LSI Technology 2004: Industry’s First SerialAttached SCSI (SAS) Controller IC 1954: Solar Battery Cell Ideas are the Source of Growth… 20
Government Industry Media Academia Investors Call To Action