Download
1 / 20
200 likes | 222 Views
Rethinking Hong Kong’s Human Resources and Competitiveness:. Richard Wong. What Hong Kong will be like -- the next two decades. The CEO Manpower Conference 2005, 18 May 2005. 1. The impact of demographic changes on the economy is deep and long.

E N D
Rethinking Hong Kong’s Human Resources and Competitiveness: Richard Wong What Hong Kong will be like -- the next two decades The CEO Manpower Conference 2005, 18 May 2005
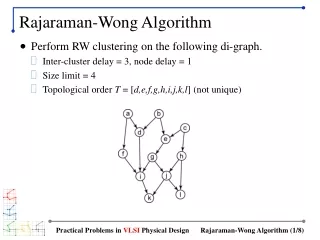
1. The impact of demographic changes on the economy is deep and long. • The border during the early years was unrestricted and there were net movements of population in both directions. • The immigration wave from Mainland China into Hong Kong in 1945-1950 is the most important reason for the post war economic miracle and continues to shape HK’s future.
Five-year percentage change of HK population by age group The impact of demographic changes on the economy is deep and long.
Hong Kong’s population is ageing – population by age groups 1921-2031 With low fertility rate and restricted immigration, Hong Kong’s population is aging quickly.
2. Nations are ageing but economically vibrant cities are not, but HK? • The economically vibrant cities generally exhibit stable population distributions by age, caused by immigration of the working age groups and emigration of older age groups. • One expects younger migrants in the fast growing cities eager to try their luck; whereas the older and less competitive people migrate out for less demanding careers and life styles. • Distribution by age group of the seven cities in 1990 and 2000appears stable, with the majority of the population in the group of 20 to 44. • The population bulge of Hong Kong has shifted approximately by 10 years from 1991 to 2001. There has been mild immigration of prime working age and younger age groups into Hong Kong, but emigration of older groups is minimal.
Distribution of population by age group (%) – China, US and UK in 1990 and 2000 National population distribution shifts by 10 years in every 10 years. Aging is a world-wide phenomenon. Almost all nations are growing old.
Distribution of population by age group (%) – selected cities in 1990 and 2000 Among these cities, Hong Kong is the only one that exhibits ageing in its population.
3. Hong Kong immigrants are dominated by Mainland dependants of Hong Kong men. • The largest group of immigrant population are poorly educated Mainland dependants of Hong Kong men. • Those in the 10-19 age groups are their children and those in the 25-45 age groups are their spouses. • They are systematically less well educated than the native population and those residents born in foreign countries.
Percentage of different groups (by place of birth) of Hong Kong’s population with a university degree, aged 15 to 59 Those born in mainland are the least educated.
Percentage of Hong Kong’s population with a university degree, aged 15 to 59 by place of birth With a “semi-closed” border with the Mainland, Hong Kong has to rely on education investment to produce its own skilled manpower Over time, higher proportion of degree holders are born in HK.
4. The education level of HK residents is lagging behind major fast growing cities • Unable to draw talents from the rest of the nation, Hong Kong’s human capital stock is lagging behind that of other leading economic cities like New York and London. • Fast growing Mainland cities are also catching up rapidly.
Percentage of the population aged 15 to 59 with a university degree, among different groups (by place of birth), New York City Those born in other US cities are the most educated. With an open border, New York draws on the rest of the US for skilled manpower.
Percentage of the population with a university degree, aged 15 to 59 by place of birth, New York New York draws on the rest of the world for skilled manpower. Over time, higher proportion of degree holders are foreign born.
Percentage of Population with Educational level as degree holders, 1990 vs 2000 Hong Kong’s human capital stock is lagging far behind that of other leading economic centers. 21% Plot-ALLCities.xls Chart-Degree+CompareALL
Percentage of Population with Educational level as degree holders, 1990 vs 2000 Population in cities are more educated than the national level. With an open border, other cities draw on the rest of the nations for skilled manpower. Plot-ALLCities.xls Chart-Degree+CompareALL
5. In 2031, the best educated in HK are going to be those in the oldest age group. • Without any change in the current level of investment in education and maintaining the current pattern and volume of immigration our best educated population will be among the most elderly. • In 2031, the projected HK population’s education level will still be far behind that in New York City today.
Percentage of degree holders out of total population in Hong Kong, 1976 to 2001 and projection into 2031 An aging population of talents ahead. Paste-Project2031-u-grad.xls Chart%TotPop76-2031degree+
Projected percentage of HK population aged 15 to 64 with different levels of education Still far from 30.2% of today’s New York City. Investment in education will produce additional skilled manpower but not enough.
6. Hong Kong must remain a vibrant space of flow. • Maximum circulation of a diverse range of talents through the territory is crucial. • Hong Kong’s population flow pales in comparison with New York City.
Distribution of New York and HK population by place of birth in 1990 and 2000.