Download
1 / 12
120 likes | 212 Views
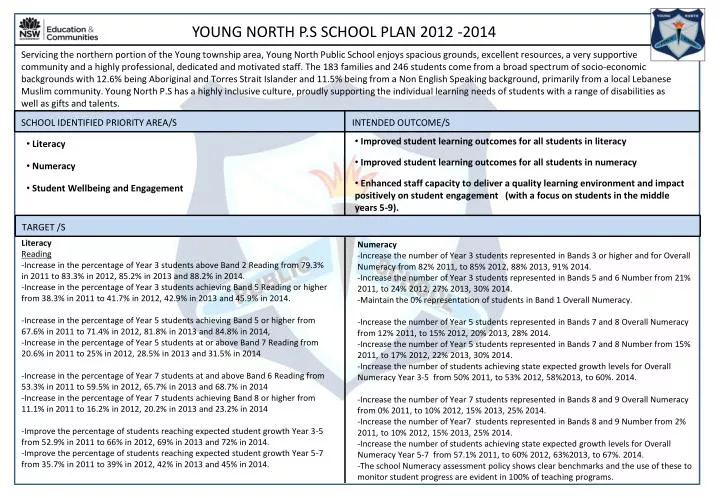
YOUNG NORTH P.S SCHOOL PLAN 2012 -2014.

E N D
YOUNG NORTH P.S SCHOOL PLAN 2012 -2014 Servicing the northern portion of the Young township area, Young North Public School enjoys spacious grounds, excellent resources, a very supportive community and a highly professional, dedicated and motivated staff. The 183 families and 246 students come from a broad spectrum of socio-economic backgrounds with 12.6% being Aboriginal and Torres Strait Islander and 11.5% being from a Non English Speaking background, primarily from a local Lebanese Muslim community. Young North P.S has a highly inclusive culture, proudly supporting the individual learning needs of students with a range of disabilities as well as gifts and talents. SCHOOL IDENTIFIED PRIORITY AREA/S INTENDED OUTCOME/S • Improved student learning outcomes for all students in literacy • Improved student learning outcomes for all students in numeracy • Enhanced staff capacity to deliver a quality learning environment and impact positively on student engagement (with a focus on students in the middle years 5-9). • Literacy • Numeracy • Student Wellbeing and Engagement TARGET /S • Literacy • Reading • -Increase in the percentage of Year 3 students above Band 2 Reading from 79.3% in 2011 to 83.3% in 2012, 85.2% in 2013 and 88.2% in 2014. • -Increase in the percentage of Year 3 students achieving Band 5 Reading or higher from 38.3% in 2011 to 41.7% in 2012, 42.9% in 2013 and 45.9% in 2014. • -Increase in the percentage of Year 5 students achieving Band 5 or higher from 67.6% in 2011 to 71.4% in 2012, 81.8% in 2013 and 84.8% in 2014, • -Increase in the percentage of Year 5 students at or above Band 7 Reading from 20.6% in 2011 to 25% in 2012, 28.5% in 2013 and 31.5% in 2014 • -Increase in the percentage of Year 7 students at and above Band 6 Reading from 53.3% in 2011 to 59.5% in 2012, 65.7% in 2013 and 68.7% in 2014 • -Increase in the percentage of Year 7 students achieving Band 8 or higher from 11.1% in 2011 to 16.2% in 2012, 20.2% in 2013 and 23.2% in 2014 • -Improve the percentage of students reaching expected student growth Year 3-5 from 52.9% in 2011 to 66% in 2012, 69% in 2013 and 72% in 2014. • -Improve the percentage of students reaching expected student growth Year 5-7 from 35.7% in 2011 to 39% in 2012, 42% in 2013 and 45% in 2014. • Numeracy • -Increase the number of Year 3 students represented in Bands 3 or higher and for Overall Numeracy from 82% 2011, to 85% 2012, 88% 2013, 91% 2014. • -Increase the number of Year 3 students represented in Bands 5 and 6 Number from 21% 2011, to 24% 2012, 27% 2013, 30% 2014. • -Maintain the 0% representation of students in Band 1 Overall Numeracy. • -Increase the number of Year 5 students represented in Bands 7 and 8 Overall Numeracy from 12% 2011, to 15% 2012, 20% 2013, 28% 2014. • -Increase the number of Year 5 students represented in Bands 7 and 8 Number from 15% 2011, to 17% 2012, 22% 2013, 30% 2014. • -Increase the number of students achieving state expected growth levels for Overall Numeracy Year 3-5 from 50% 2011, to 53% 2012, 58%2013, to 60%. 2014. • -Increase the number of Year 7 students represented in Bands 8 and 9 Overall Numeracy from 0% 2011, to 10% 2012, 15% 2013, 25% 2014. • -Increase the number of Year7 students represented in Bands 8 and 9 Number from 2% 2011, to 10% 2012, 15% 2013, 25% 2014. • -Increase the number of students achieving state expected growth levels for Overall Numeracy Year 5-7 from 57.1% 2011, to 60% 2012, 63%2013, to 67%. 2014. • -The school Numeracy assessment policy shows clear benchmarks and the use of these to monitor student progress are evident in 100% of teaching programs.
TARGET /S: Continued • Literacy continued • Writing • -Increase in the percentage of Year 3 students in Band 5 Writing or higher from 57% in 2011 to 60% in 2012, 63% in 2013 and 65% in 2014. • -Increase in the percentage of Year 5 students achieving Band 7 Writing or higher from 15% in 2011 to 18% in 2012, 25% in 2013 and 30% in 2014. • -Increase in the percentage of Year 7 students achieving Band 7 Writing or higher from 21% in 2011 to 24% in 2012, 30% in 2013 and 35% in 2014. • Staff Capacity Building and Professional Development • -Co-ordinated staff involvement in Professional Learning activities evidenced by improved teaching and learning outcomes from < 10% in 2011 of teaching staff having active Professional Learning Plans to 50% of teaching staff having active -Professional Learning Plans in 2012, 75% in 2013 and 100% in 2014. • -100% of staff and SLSO have received ‘Focus on Reading training’ and strategies are evident in 100% of classroom programs. • -100% of staff have engaged and are actively committed to PBL workshops, planning and implementation. • -All staff have participated in Executive led systematic implementation of Team Leadership for School Improvement Workshops and learning experiences with school improvement evidenced by a minimum of 1 criteria movement for all evaluation matrix items. • Student Wellbeing / Community Engagement • -Increase playground harmony from daily teacher intervention at all play times to peer resolution by students. Evidenced by reduced weekly RISC contact baseline data (from 2011 figures) by 5% 2012, 10% 2013, 20% 2014. • -Improve student (pre and post test surveys) in positive student resilience incidences each year 2012 - 2014. • -Increase school capacity to support students with challenging behaviours evidenced by 4yr longitudinal tracking of a focus group’s performance that displays consistent growth in Literacy and Numeracy and expected state growth in NAPLAN data. • -Increased community engagement and improved relationships with the school as evidenced by increased numbers in attendance, participation and involvement in a range of school-based activities and events ie parent teacher interview data, attendance at parent information workshops, attendance at orientation and transition events and P&C attendance. • -Increased parent satisfaction with school promotion and connectedness with community evidenced by 25% increase 2012-2014 in average ‘strongly agree’ response selection to ‘Building community and identity’ subsection questions in NSP Sit Analysis baseline data survey. • -Increase student connectedness to learning as demonstrated by 25% increase 2012-2014 in average ‘strongly agree’ response selection to ‘Quality of School Life’ subsection questions in NSP Sit Analysis baseline data survey. • -Reduce the total number of suspensions, short and long term, from 2011 baseline data by 5% 2012, 15% 2013, 25% 2014. PRINCIPAL’S SIGNATURE: KelSmerdonSED ENDORSEMNT: Sandra Clifford DATE: 9 November 2011DATE:
Student Engagement / Quality Learning Environment Priority / Outcome Strategies Indicators Timeframe Responsibility Resources/ Reform 2012 2013 2014 Budget • Regular and systematic professional learning to support whole school systems and staff confidence and capacity to support student welfare. • Evidence of revised and new systems and school policy to support student welfare needs. • A reduction in long and short term student suspensions. • Reduced RISC contacts for disrespectful and peer conflict based behaviours. • Improved student NAPLAN performance data due to enhanced learning environment. • Improved student responses in QSL surveys as outlined in 2012-2014 targets. • Evidence of clear communication and evidence based decision making coming from the schools LST. • Evidence of integrated Aboriginal Education components top all K-6 class programs. NSP Reform 1 Bolster Exec Support .21 RFF $19 803 -Admin/Resource costs $1000 Global allocation • 1. Develop an Assistant Principal-Engagement role with .21 RFF and release this staff member to: • proactively work on systems analysis, school improvement and staff development. • supervise and support the existing SLST (.4) • proactively work on PBL and ‘You Can Do it’ implementation • 2.Develop improved student induction and orientation systems to better support student entry into Young North P.S • 3.Implement PBL, utilising the initial data gathering phase to support a review of the school’s learning support team with the assistance of Regional Behaviour support staff / NSP released AP (1) • 4.Build on this data driven process and improved LST to highlight links between student behaviour needs and quality learning environment/engagement. • 5. Implement ‘You Can do It’ as a medium term proactive whole school respectful behaviour and resilience focus and align with PBL focus values as this initiative grows. • 6. In-service whole school on ATSI Ed Action Plan and audit Aboriginal Education programming. 1.Principal- To run recruitment AP- Engagement Reforms 1 4 5 Aboriginal ED ACTION PLAN DOMAIN LINKS 2 5 REGIONAL PLAN LINKS Eng/Att Lead/Man ATSI Ed Curric Improved whole school capacity to proactively improve school welfare programs. 2. $1000 for casual and resource needs- Global allocation • 2. AP Engagement • With : • Principal • LST • SLST • 3. Buy in $2000 TPL. • -AP support NSP as above. • -Additional release days to support • $2000 TPL. • Resource and admin $2000 Global allocation • 4. Resources / casual $1000 TPL • 5. NSP Reform 3 • Add .02 to RFF to support ‘You Can Do It’ - $2370 • Resources $1500 TPL / Global. • 3. AP Engagement • With : • Whole staff • PBL Coach • AP Behaviour / ISTB • 4. AP Engagement • With : • LST • PBL Coach • AP Behaviour / ISTB 5. AP Engagement With : Whole staff
Priority / Outcome Strategies Indicators Timeframe Responsibility Resources/ Reform 2012 2013 2014 Budget • Successful recruitment of teacher and SLSOs for centre. • Completed behaviour and counsellor profiling of each student. • Policy review and new procedures developed for centre’s implementation. • Production of ILPs for each student and integration to homebase structures in place. • Evidence of shared behaviour management strategies to homebase classroom teacher from centre staff. • Positive school and parent relationship developed through transparent process and clear communication. • Evidence of strong student NAPLAN growth data. • Reduced suspension and RISC contact data for targeted students. • Anecdotal and focus group evidence of increased student self esteem, capacity to resolve conflict and self regulation. 1.Principal- To run recruitment Centre Staff Reforms 1 3 4 6 Aboriginal ED ACTION PLAN DOMAIN LINKS 2 6 REGIONAL PLAN LINKS Eng/Att Lead/Man ATSI Ed Curric 1.Develop a specific school classroom environment (Engagement Centre) that caters for students with specific behaviour needs. Room to have maximum 10 students with 1 teacher and 2 aides using NSP funding, and Funding Support. 2.Ensure this model maximises individual student engagement and performance by individually targeting learning needs and effectively utilising learning technologies. 3.Develop effective transition plans for these students in and out of a homebase classrooms and playground as appropriate. 4.Ensure the whole school capacity to engage students with high behaviours support needs is enhanced through whole school professional learning and a committed whole school approach to transition in and out of homebase classrooms. 5.Broker more effective linkages with Mental Health, AECG, Autism and community agencies to holistically support students and families. 6. Provide up to 3 places in the above detailed ‘Student Engagement’ centre for students to fill prior to and after full suspension and develop reengagement strategies for these places. NSP Reform 3 1. 1 x teacher $75,932 1x SLSO $38,856 $2000 Lit/Num Resources for establishment Funded by NSP - 1xSLSO funded by Funding Support Strengthened whole school capacity to engage students with high level behaviour support needs. 2.Centre staff Supported by Principal and LST 3.Centre staff Supported by Principal and LST 4. $2000 from TPL 4.Centre staff Supported by Region/external providers. 5. Principal, LST AP Engagement with SLST
Priority / Outcome Strategies Indicators Timeframe Responsibility Resources/ Reform 2012 2013 2014 Budget • 1.Utilise RISC data and focus groups to gain greater clarity of Stage 3 learner’s needs and attitudes to learning. • 2.Develop a Year 5 leadership course for implementation prior to captaincy selection and include implementation of the Better Buddy program as part of kinder transition to enhance senior leadership profile and skills. • 3.Develop an effective SRC to greater impact student leadership K-6 and audit/develop a leadership development scope and sequence for whole school. • 4.Implement staff professional learning (with support from PSP consultants on: What makes the middle years learner and how do they learn? Along with strategies that engage middle years learner. • 5.Audit whole school ICT usage using the DEC CLAS teacher evaluation tool and provide tailored professional learning that meets individual teacher needs in order to impact upon authentic learning and student engagement in Stage 3. • 6.Build stronger links with the Young AECG and Muslim community to improve cultural linkages, enhance curriculum relevance and develop student mentors. Reforms 3 4 6 Aboriginal ED ACTION PLAN DOMIAN LINKS 2 5 REGIONAL PLAN LINKS Eng/Att Lead/Man ATSI Ed Curric Enhanced school capacity to offer a quality learning environment and engage learners in the middle years 5-9. • Effective usage of RISC data and PBL data gathering highlights action points and supports target setting. 1.Principal with whole staff. 2. Better Buddy Buy in is grant funded. $500 for resources. - Leadership program resources $500 Global allocation • Positive student and parent feedback and survey data regarding Kinder Buddy and Year 5 Leadership programs. 2. Principal/ SLST to support Kinder and Stage 3 staff . 3. SRC coordinator • Evidence of student lead school improvement initiatives driven by functioning SRC. • Enhanced staff knowledge of middle year learners and evidence of this in classroom teaching and learning programs. • Evidence of next step ICT professional learning needs in individual staff learning plans. • Evidence of regular consultation meetings with AECG and Muslim community members. 4. AP -Engagment in consultation with Regional and external providers. 4. $1000 from TPL 5. Whole staff 5. $3000 from TPL for ongoing PD 6. Principal
Priority / Outcome Strategies Indicators Timeframe Responsibility Resources/ Reform 2012 2013 2014 Budget • 1. Survey parents and preschools regarding current orientation and transition linkages P-K 6-7 and develop an action plan to enhance these relationships through expanded transition programs. • 2. Seek support from PSP community linkage staff and develop regular community linkage events in the areas of literacy and numeracy, aligning school welfare to home and info/sharing sessions with local preschool staff. • 3. Seek support from DEC school promotions support staff and build community linkages to develop a new school marketing and promotions strategy. • 4. Work with Young High School and Young Public School to develop stronger public school partnerships in Young. Focus areas to include: • Network promotion • Transition to high school • Shared staff learning • Middle years initiatives • Aboriginal Education • 5.Joining with other schools to create a Partnership Mentor position at PH2 level to support leadership development programs, provide training in analysis of data, support induction of early career teachers and co-ordinate professional learning networks. • Action plan developed and is guiding 2012 Kinder transition process. • Preschool staff and YNPS staff hold a sharing forum. • PSP consultant led parent workshops are timetabled and then implemented with clear communication to community. • School promotion plan developed with support and DEC promotions support officer. Areas of need addressed. • Evidence of regular joint planning and sharing between Young school Principals as well as joint staff initiatives/PD opportunities. Reforms 3 6 Aboriginal ED ACTION PLAN DOMAIN LINKS 1 4 5 REGIONAL PLAN LINKS Eng/Att Lead/Man ATSI Ed Curric Improved community links and community perception of YNth PS as a quality learning environment. 1. SLST with Kinder teacher 1.$500 Resources and release Global allocation. 2. $1000 PSP funding 3. $1500/year over 3 yrs. 4.To be determined 5. NSP Reform 3 $12 798NSP Funding 2. Principal with PSP consultants. ? ? 3. Principal with PSP consultants. 4. Principal with support of whole staff , YHS and YPS. 5. Regional Coordinator Principal
Literacy Priority / Outcome Strategies Indicators Timeframe Responsibility Resources/ Reform 2012 2013 2014 Budget • 1.Provide whole staff with SMART data training utilising SDO support. • Provide extended training to AP Learning and STLA to support data driven decision making capacity. • 2.Utilise SMART data item analysis, Best Start data and SMART teaching support links to target specific areas of need in both classroom program delivery as well as STLA and SLST support programs. • 3. Utilise Best Start data to effectively support Kinder students. • 4.Develop and Assistant Principal-Learning role with 0.2 RFF to support: • Audit of teaching and learning programs in Literacy to ensure outcomes based teaching and learning is evident in the highlighted target areas. • Support the implementation of targeted professional learning. • Work on mentoring, team teaching and lesson study approaches to develop staff skills and implementation of National Curriculum. • Manage implementation of and support regional support staff input • 5.Utilise Team Leadership for School Improvement (TLSI) profiling, analytical framework and learning modules to evaluate and improve school systems, leadership and programs in Literacy. • 6. Exec to attend state Equity Conf Reforms 1 2 4 Aboriginal ED ACTION PLAN DOMAIN LINKS 1 2 4 REGIONAL PLAN LINKS Lead/Man Curric Lit/Num Release $900 TPL funds Improve staff capacity to effectively utilise data to drive improved professional learning and teaching and learning programs in Literacy. • Staff have completed training and evidence of improved data based discourse in staff discussions. • Evidence of SMART teaching strategy tools being used in classroom programming. • Planned, systematic and varied professional learning occurring and evidence of strong literacy components to individual staff learning plans. • Evidence of improved Executive team stance and planned Team Leadership for School Improvement module deliver is occurring with Executive’s delivering . 1. SDO with whole staff 2. Principal with AP-Learning and STLA. 4. NSP Reform 1 Bolster Exec Support .21 RFF $19 803 (Shared Lit/Num) 3. Principal to recruit. 5. NSP Reform 5 Seeding funds TLSI Training of Exec $1588 6. NSP Reform 4 Seeding funds Equity Conf $2468 3. Executive Team to whole staff.
Priority / Outcome Strategies Indicators Timeframe Responsibility Resources/ Reform 2012 2013 2014 Budget Reforms 1 3 4 6 Aboriginal ED ACTION PLAN LINKS REGIONAL PLAN LINKS Eng/Att Lit/Num Enhance staff and community capacity to support improved outcomes in reading. 1.Audit LST, STLA and SLST systems, resource usage and program delivery and expand the usage of SMART data evidence to inform and guide program delivery. 2. Work with PSP community linkage staff to develop regular parent workshops to positively impact upon home to school learning partnerships in reading. 3. Survey parents and preschools regarding current orientation and transition linkages P-K and develop an action plan to enhance these relationships through expanded transition programs and P-K staff sharing forums. 4.Train two staff members in ‘Focus on Reading program’ Phase 1 and 2 to support staff with regional assistance to continue strong K-3 reading levels and target students requiring strong explicit teaching in order to shift into top two bands. Provide additional release time to support integration into programs. 5. Continue existing PSP funded Guided Reading Program K-2 and enhance by training all delivery staff in effective Guided Reading strategies to ensure a consistent and high level program and strong learning outcomes. • STLA and LST are developing student case loads that reflect data driven decision making and improved SMART usage. • Improved dialogue with local preschools and effective P-K transition. • Focus on reading training attended by AP Learning +1 and being passed on to all staff with support of Regional staff. • Teacher knowledge of teaching Yr 3-6 readers has increased along with the quality of programming and lesson delivery. • NAPLAN reading data reflects positive student skill band progression and growth data 3-5 and 5-7. • L3, Yr 3 NAPLAN and Yr 1 and 2 benchmarking guides ES1 and S1 target setting for a continuation of strong K-3 reading performance. 1. Principal with AP Engagement and LST 2. PSP community support with Principal 2. Resources $1000 PSP. ? ? 3. Principal with SLST. 3. Resources $500 PSP. 4. NSP Reform 4 Focus On Reading 2012 Phase 1 NSP -$2490 Casual Cost - $880 Course fees -Implementation Casual $1000 TPL -2013 Phase 2 As for Phase 1 4. AP Learning +1 to be trained then provide PD with regional support. 5. AP Learning and STLA to supervise and manage. ? ? 5. PSP staffing allocation top up with $8500 PSP
Priority / Outcome Strategies Indicators Timeframe Responsibility Resources/ Reform 2012 2013 2014 Budget • -Clear data has been collected outlining student strengths and needs in order to achieve in top 2 Bands. • -SMART teaching strategies are evident in classroom programs along with examples of differentiation for high achieving students. • Eager learners classes are successfully formed including the development of appropriate policy and systems and are positively supported by community and students. • AP Learning, Regional Support and Focus on Reading trained staff are planning and implementing professional learning to support. • LST structures have improved to include the support of students with gifts and talents. • NAPLAN skill band data reflects student representation in top 2 Bands that reaches or exceeds targets. • HOW2Learn strategy is being piloted in both eager learners’ classes. 1. Perform whole school analysis of NAPLAN using SMART to identify school strengths and weaknesses with alignment to syllabus outcomes in the top two bands Yr 3,5and 7 as well as item analysis-order of difficulty analysis to examine performance on difficult question. 2.Implement flexible class structures and student movement strategies to offer enhanced learning environments and student engagement for higher performing students. This would include the establishment of Stage 2 and Stage 3 independent learner classes through the purchase of an additional staff member. 3.Implement ‘Focus on Reading program’ to continue strong K-3 reading levels and target students requiring strong explicit teaching in order to shift into top two bands. 4.Provide professional learning to support staff in catering for higher achieving students as well as effective differentiation of the curriculum. 5.Work with Riverina regional staff and SED to pilot regional learning strategy HOW2Learn as a means of improving student engagement, developing a lifelong learning culture and enhancing the relevance of learning. 1. Principal with STLA and AP-Learning Reforms 3 5 4 Aboriginal ED ACTION PLAN DOMIAN LINKS 2 4 6 REGIONAL PLAN LINKS Lead/Man Curric Lit/Num Improve school capacity to support the needs of higher performing students in Literacy. 2. Principal to recruit and manage policy. 2. NSP Reform 3 1x teacher to facilitate enrichment classes $72 218 (as per Numeracy) 3. AP Learning +1 to be trained then support staff. As costed on previous page. 4. Sue Najor / AP Learning 5.Training costs $1000 TPL 4. Eager Learner’s teachers supported by Regional personnel
Numeracy Priority / Outcome Strategies Indicators Timeframe Responsibility Resources/ Reform 2012 2013 2014 Budget Improve staff capacity to effectively utilise data to drive improved professional learning and teaching and learning programs in Numeracy. • -Clear data has been collected outlining student strengths and needs in order to achieve in top 2 Bands. • -SMART teaching strategies are evident in classroom programs along with examples of differentiation for high achieving students. • Eager learners classes are successfully formed including the development of appropriate policy and systems and are positively supported by community and students. • AP Learning and Regional Support are planning and implementing professional learning to support. • LST structures have improved to include the support of students with gifts and talents. • NAPLAN skill band data reflects student representation in top 2 Bands that reaches or exceeds targets. • TLSI PD results in enhanced staff dialogue regarding Numeracy planning and target setting • 1.Provide whole staff with SMART data training utilising SDO support. • Provide extended training to AP Learning and STLA to support data driven decision making capacity. • 2.Utilise SMART data item analysis and teaching support links to target specific areas of need in both classroom program delivery as well as STLA and SLST support programs. • 3.Develop an Assistant Principal-Learning role with 0.2 RFF to support: • Audit of whole school assessment and tracking procedures in mathematics K-6. • Support the implementation of targeted professional learning. • Work on mentoring, team teaching and lesson study approaches to develop staff skills and improve classroom programs. • Support regional support staff input • 4.Utilise Team Leadership for School Improvement profiling and analytical framework to improve: • -Clear communication of improvement targets. • - Capacity to meet learning needs of full school population including ATSI students. • Assessment and monitor • Feedback to student systems. • Strategic planning of PD and staff personal learning plans. Reforms 1 2 4 Aboriginal ED ACTION PLAN DOMAIN LINKS 2 4 REGIONAL PLAN LINKS Lead/Man Curric Lit/Num Release $900 TPL funds (as allocated in Literacy) 1. SDO with whole staff 2. Principal with AP-Learning and STLA. 3. NSP Reform 1 Bolster Exec Support .21 RFF $19 803 (Shared Lit/Num) 3. Principal to recruit then supported by Regional Numeracy consultant. 4. NSP Reform 5 Seeding funds TLSI Training of Exec (As included in lit) 3. Executive Team to whole staff.
Priority / Outcome Strategies Indicators Timeframe Responsibility Resources/ Reform 2012 2013 2014 Budget Casual release $1000 TPL ICT Casual release $1000 TPL Numeracy 4. Resourcing $500 Global Allocation 6. PSP Funding Reforms 3 5 4 Aboriginal ED ACTION PLAN LINKS 2 4 REGIONAL PLAN LINKS Eng/Att Lead/Man Curric Lit/Num ATSI Ed Enhance staff and community capacity to support improved outcomes in Number. 1. PSP consultant CLI VC session. 2.Regional Support staff to guide AP-Learning 3.LST with STLA 4. Principal with PSP community linkage support. Principal with LST, STLA Principal • Staff demonstrate enhanced confidence in IWB and VC usage to teach Numeracy. • CMIT strategies clearly represented in teaching and learning programs. • STLA focus groups occurring as a result of LST decision making. • Parent workshops held with positive exit survey data. • ILPs and PLP completed as required with Numeracy focus. • NAPLAN data depicts yearly targets being reached or exceeded. • Numeracy focus in 100% of staff personal learning plans. • 1. Audit school resources and provide staff with professional learning to support effective IWB, VC and broader ICT resources usage in Numeracy. • 2. Examine current implementation of CMIT program and develop action plan to move to full implementation. • - Including the use of lesson study and team teaching to support classroom practice. • 3. Utilise SMART Item analysis and ES1 S1 assessments to develop target groups of students for STLA supported skills backfilling focus. • Student selection to be data driven based on common outcome deficit. • Students attend for short small group focus and then assessed on exit. • 4. Purchase and implement Parents Count Too support materials and conduct Numeracy based parent workshops with the support of PSP community partnerships officer. • 5. Ensure all Aboriginal PLPs and Band 1 ILP contain Number focus based on data driven needs. • 6. All staff personal learning plans to include a Numeracy focus.
Priority / Outcome Strategies Indicators Timeframe Responsibility Resources/ Reform 2012 2013 2014 Budget 4. Resourcing $1000 Global Allocation • 1. Perform whole school analysis of NAPLAN using SMART to identify school strengths and weaknesses with alignment to syllabus outcomes in the top two bands Yr 3,5and 7 as well as item analysis-order of difficulty analysis to examine performance on difficult question. • 2.Implement flexible class structures and student movement strategies to offer enhanced learning environments and student engagement for higher performing students. This would include the establishment of Stage 2 and Stage 3 independent learner classes through the purchase of an additional staff member. • 3. Utilise the support of Regional support staff to provide professional learning to classroom teachers in the areas of: • Effective differentiation of the curriculum /implementation of the Australian Curriculum. • Effective usage of problem solving and teaching ‘working mathematically’ syllabus content. • 4. Implement vertical and horizontal enrichment opportunities for keen mathematicians / thinkers including: • Tournament of the Minds • Enrichment days with YPS/YHS Reforms 3 5 4 6 Aboriginal ED ACTION PLAN LINKS 2 4 REGIONAL PLAN LINKS Eng/Att Curric Lit/Num Improve school capacity to support the needs of higher performing students in Literacy. 1. Principal 2. Principal to recruit 3. AP-Learning with support of Regional Officers 4. Principal with support YPS YHS • SMART teaching strategies being used to support student to achieve top two bands. • Eager learners classes are successfully formed including the development of appropriate policy and systems and are positively supported by community and students. • Student focus group data suggests that higher performing students are being presented with a rich and engaging curriculum. • Student NAPLAN performance in Top 2 bands meets or exceeds school targets. • Enrichment opportunities presented to students and inter school opportunities have been held. 2. NSP Reform 3 1x teacher to facilitate enrichment classes $72 218