Download
1 / 15
150 likes | 265 Views
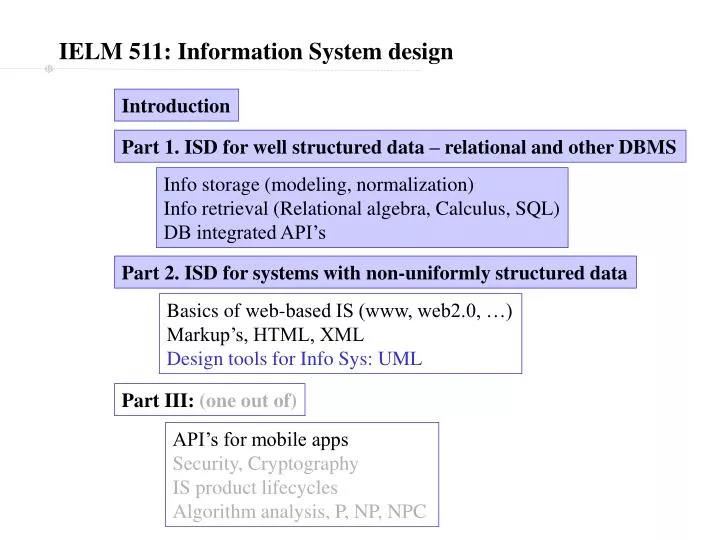
IELM 511: Information System design. Introduction. Part 1. ISD for well structured data – relational and other DBMS. Info storage (modeling, normalization) Info retrieval (Relational algebra, Calculus, SQL) DB integrated API’s. Part 2. ISD for systems with non-uniformly structured data.

E N D
IELM 511: Information System design Introduction Part 1. ISD for well structured data – relational and other DBMS Info storage (modeling, normalization) Info retrieval (Relational algebra, Calculus, SQL) DB integrated API’s Part 2. ISD for systems with non-uniformly structured data Basics of web-based IS (www, web2.0, …) Markup’s, HTML, XML Design tools for Info Sys: UML Part III: (one out of) API’s for mobile apps Security, Cryptography IS product lifecycles Algorithm analysis, P, NP, NPC
Agenda UML as a design and documentation tool When to use UML Common UML diagrams: - Structure diagrams -- Class; Component; Object; Composite structure; Deployment; Package - Behavior diagrams -- Activity; Use case; State machine diagrams -- Interaction diagrams: Communication; Sequence; Timing; Interaction overview Concluding remarks
When to use UML Classical system development tool: Flowcharts Problems: - Complex programs flowchart too complex, non-planar graph - Does not provide a good ‘state-machine’ view - Procedural; cannot provide good view of objects and their interaction … Universal Modeling Language - Provides tools to describe system, components, and their interactions - Useful in design - Useful in documentation and system updates/modifications/debugs - Natural tool for Objet Oriented Programming
UML overview Graphical description of all information about a system -- Static information : diagrams to document the structure of the system -- dynamic information: diagrams that describe how the system behaves Structure Behavior Use case Class Activity Object State machine Component Interaction Deployment Sequence Composite structure Interaction overview Package Communication Timing Reference for the following: Randy Miller, EDM
Class diagram Class diagrams give an overview of the system by showing the classes and relationships between them. Most closely related to the data structure of the program Every class diagram has classes, associations, and multiplicities.
Package diagrams Class diagrams can become very large and complex; objects (or packages) can be used to group classes into higher level entities, i.e. packages Example: a business model in which the classes are grouped into packages
class diagram an instance of this class Object diagrams Sometimes each instance of a class itself may have a complex structure. Object diagrams are used to illustrate the structure of one instance of an object Example: a university Department that contain lots of other Departments.
Component and Deployment Diagrams A component is a code module; component diagrams map directly to the program structure. Deployment diagrams show the physical configurations of software and hardware. Example: The deployment diagram below shows the relationships among software and hardware components involved in real estate transactions
Use case diagrams Use case diagrams illustrate what the system does, i.e. what functionality it provides (an analogy is the user-guide for a device). Example: Medical clinic scenario A patient calls the clinic to make an appointment for a yearly checkup. The receptionist schedules the appointment.
Activity diagrams Activity diagrams focus on the flow of activities involved in a single process (similar to flowcharts), showing how activities are related to one another. Example: Activity: withdraw money from ATM machine Classes involved: customer, ATM, bank
State machine (statechart) diagram The state of an object depends on its current activity or condition. A statechart diagram shows the possible states of the object and the transitions that cause a change in state. Example: Log in to an online banking system (provide valid SSN + PIN validation).
Sequence diagrams A sequence diagram shows how operations are carried out: what messages are sent and when. Time flows from top to bottom of diagram. Example: Sequence diagram for making a hotel room booking
Interaction overview (collaboration) diagrams Collaboration diagrams show the interactions between objects, similar to sequence diagrams, but without the showing the timing of events. Example: interaction diagram for making a hotel room booking
Practical issues in UML use Lots of different diagrams, many different types of arrows, lines, line styles, box shapes etc. complex, difficult to learn. Many software programs exist that allow designers to specify UML diagrams; some tools can automatically convert UML diagram specs into programs (e.g. Java code). Example: Eclipse. Summary of UML tools (free, commercial) on wikipedia.
References and Further Reading UML on wikipedia Randy Miller’s excellent introduction to UML Object Modeling Group’s UML web-page Next: IS and Secure communications