Download

1 / 46
510 likes | 564 Views
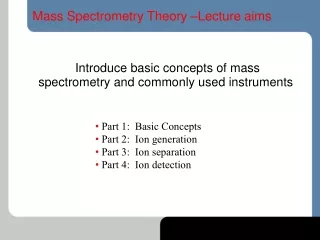
Mass spectrometry lecture. What kind of info can mass spec give you?. Molecular weight Elemental composition (low MW with high resolution instrument) Structural info (hard ionization or CID). How does it work?.

E N D
What kind of info can mass spec give you? • Molecular weight • Elemental composition (low MW with high resolution instrument) • Structural info (hard ionization or CID)
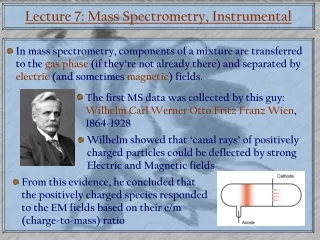
How does it work? • Gas-phase ions are separated according to mass/charge ratio and sequentially detected
Parts of a Mass Spec • Sample introduction • Source (ion formation) • ________________________ • Mass analyzer (ion sep.) high vac • Detector (electron multiplier tube)
Sample Introduction/Sources Volatiles • Probe/electron impact (EI),Chemical ionization (CI) • GC/EI,CI Involatiles • Direct infusion/electrospray (ESI) • HPLC/ESI • Matrix Assisted Laser Desorption (MALDI) Elemental mass spec • Inductively coupled plasma (ICP)
EI, CI • EI (hard ionization) • Gas-phase molecules enter source through heated probe or GC column • 70 eV electrons bombard molecules forming M+* ions that fragment in unique reproducible way to form a collection of fragment ions • EI spectra can be matched to library stds CI (soft ionization) • Higher pressure of methane leaked into the source (mtorr) • Reagent ions transfer proton to analyte
CI/ ion-molecule reaction • 2CH4 + e- CH5+ and C2H5+ • CH5+ + M MH+ + CH4 • The excess energy in MH+ is the difference in proton affinities between methane and M, usually not enough to give extensive fragmentation
Electrospray • 5 kV voltage on a needle • Nebulization gas • Produces gas-phase protonated analytes • Little to no fragmentation • Multiple charging • 10 mM angiotensin at 5 ml/min direct infusion, MW 1269
] 100 649.2 433.3 95 90 85 80 75 70 65 60 55 Relative Abundance 50 45 40 35 30 25 1296.6 20 15 671.1 10 682.1 647.5 1340.6 5 784.4 534.4 371.1 1362.5 1028.4 214.0 1127.3 810.8 928.6 1440.1 1525.6 1607.1 1743.0 1820.4 1989.0 1160.0 0 200 400 600 800 1000 1200 1400 1600 1800 2000 m/z
MALDI • Matrix -UV absorber, ex. picolinic acid, cinnimic acid • Singlely charged ions • Need mass analyzer with a large m/z range – TOF • Laser pulse as opposed to continuous source
Mass Analyzers • Low resolution • Quadrupole • Ion trap • High resolution • TOF time of flight • Sector instruments (magnet) • Ultra high resolution • ICR ion cyclotron resonance
Resolution • R = m/z/Dm/z • Unit resolution for quad and trap • TOF up to 15000 • FT-ICR over 30000 • MALDI, Resolve 13C isotope for a protein that weighs 30000 • Resolve charge states 29 and 30 for a protein that weighs 30000
High vs low Res ESI • Q-TOF, ICR • complete separation of the isotope peaks of a +3 charge state peptide • Ion abundances are predictable • Interferences can be recognized and sometimes eliminated • Ion trap, Quad • Unit resolution
MVVTLIHPIAMDDGLR 594.3 901.4 594.7 C78H135N21O22S2+2 LCQ C78H135N21O22S2+3 100 Q-TOF 891.7 95 90 891.2 DM/zth = 7.0 Xcorr = 3.09 595.0 85 80 R = 0.88 DM = 9.7 DM/z = 7.0 902.3 75 601.3 70 DMth = 10.5 892.6 65 595.3 601.7 60 601.0 55 602.0 50 900.6 45 40 35 m/z 30 25 20 15 10 5 0 m/z MVVTLIHPIAMDDGLR
Exact Mass Determination • Need Mass Spectrometer with a high mass accuracy – 5 ppm (sector or TOF) • C9H15NO4, FM 201.1001 (mono-isotopic) • Mass accuracy = {(Mass Error)/FM}*106 • Mass Error = (5 ppm)(201.1001)/106 = 0.0010 amu
Mass accuracy • Mass Error = (5 ppm)(201.1001)/106 = 0.0010 amu • 201.0991 to 201.1011 (only 1 possibility) • Sector instruments, TOF mass analyzers • How many possibilities with MA = 50 ppm? with 100 ppm?
Where: • mi = mass of analyte ion • zi = charge on analyte ion • E = extraction field • ti = time-of-flight of ion • ls = length of the source • ld = length of the field-free drift region • e = electronic charge (1.6022x10⁻¹⁹ C)
Sector instrumentshttp://www.chem.harvard.edu/mass/tutorials/magnetmovie.html
FT-ICRMS • http://www.colorado.edu/chemistry/chem5181/MS_FT-ICR_Huffman_Abraham.pdf
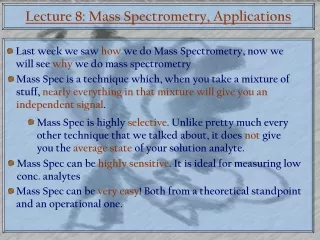
CID or MS-MS • MS-MS • sequencing the peptides or oligonucleotides • structural characterization of drugs and metabolites • Assay development, sensitivity enhancement
m/z response m/z chromatogram time HPLC-MS-MS
hybrids • Ex. Q-TOF • Trap has excellent sensitivity (can store essentially all ions), mass selectivity (can store ions of a particular m/z ratio • TOF is a high resolution mass analyzer • Triple quadruple • Neutral loss scan
HPLC-MS • Reverse-phase HPLC • Separation of involatiles (peptides) • The lower the flow the greater the sensitivity • Column ID (300 mm – 50 mm)
Proteomics using LC-MS • Protein identification, characterization, quantification • Extract proteins, fractionate proteins (typically using 2D-gel electrophoresis) • Digest protein(s) with a protease to produce peptide mixture (lysine, arginine) • LC-MS-MS analysis • Database searching identifies proteins • Mascot, Expasy (tools)
RP-HPLC Separation of a Tryptic Digest of BSA 11.36 17.23 100 95 90 85 12.57 80 12.74 75 Peptide used in following illustration 70 65 Relative Abundance 60 55 50 45 17.68 40 36.21 35 1.21 24.95 15.13 30 25 24.53 20 22.46 2.54 15 3.01 5.43 21.73 6.14 25.20 10 20.41 48.55 27.31 37.18 5 29.53 32.43 40.11 45.43 0 0 5 10 15 20 25 30 35 40 45 Time (min)
100 95 90 85 80 75 70 65 60 55 Relative Abundance 50 45 40 35 30 25 20 15 10 5 0 400 600 800 1000 1200 1400 1600 1800 m/z Mass Spectrum of a Tryptic Peptide from BSA 784.6 (M+2H)+2 785.4 (M+H)+ 1568.6 795.6 1567.5 1121.4 812.5 1122.5 830.4 1280.4 1234.4 1064.4 1570.6 852.5 691.5 1365.5 997.4 1180.3 391.0 428.9 1477.0 591.3 1706.0 1768.7
100 95 90 85 80 75 70 65 60 55 Relative Abundance 50 45 40 35 30 25 20 15 10 5 0 300 400 500 600 700 800 900 1000 1100 1200 1300 1400 1500 m/z MS-MS Spectrum D A F L G S F L Y E Y S R Residue mass S 87.0 Y 163.1 E 128.1 L 113.1 F 147.1 G 57.0 D A F L G S+ m/z 590 S Y G E L Y F L S
Peptide Mass Mapping MKWVTFISLL LLFSSAYSRG VFRRDTHKSE IAHRFKDLGE 567.95 1249.17 EQFKGLVLIA FSQYLQQCPF DEHVKLVNEL TEFAKTCVAD ESHAGCEKSL HTLFGDELCK VASLRETYGD MADCCEKQEP ERNECFLSHK DDSPDLPKLK PDPNTLCDEF KADEKKFWGK 655.84 1305.29 YLYEIARRHP YFYAPELLYY ANKYNGVFQD CCQAEDKGAC LLPKIETMRE KVLASSARQR LRCASIQKFG ERALKAWSVA 842.19 1439.32 RLSQKFPKAE FVEVTKLVTD LTKVHKECCH GDLLECADDR ADLAKYICDN QDTISSKLKE CCDKPLLEKS HCIAEVEKDA IPENLPPLTA DFAEDKDVCK NYQEAKDAFL GSFLYEYSRR 927.16 1480.26 HPEYAVSVLL RLAKEYEATL EECCAKDDPH ACYSTVFDKL KHLVDEPQNL IKQNCDQFEK LGEYGFQNAL IVRYTRKVPQ 1567.23 1001.22 VSTPTLVEVS RSLGKVGTRC CTKPESERMP CTEDYLSLIL NRLCVLHEKT PVSEKVTKCC TESLVNRRPC FSALTPDETY VPKAFDEKLF TFHADICTLP DTEKQIKKQT ALVELLKHKP 1083.21 1639.40 KATEEQLKTV MENFVAFVDK CCAADDKEAC FAVEGPKLVV STQTALA 1142.29 1750.43 1193.16 2211.37
LC-MS-MS analysis • Characterization of synthetic processes • Drug metabolism studies – structural elucidation of metabolites • Quantification of polar molecules in biological samples – NAD
NAD Assay • Goal to determine the relative importance of the different biosynthetic pathways. • Stable isotopic incorporation
NAD Synthesized from Labeled Precursors NAD synthesized from a) 2H4 labeled nicotinic acid and nicotinamide (m/z 667) b) 13C5 labeled tryptophan (m/z 669) c) 13C6 labeled quinolinic acid (m/z 670)
The Experimental Strategy • Culture cells in media containing isotopically labeled precursors for fixed time intervals • Harvest and lyse the cells, extract the NAD, and quantitate the unlabeled and labeled NAD using reverse-phase LC-MS-MS
m/z 664 m/z 542 m/z 692 m/z 562 Sensitivity advantage
Standard Curve • • 39 pts • Detection Limit: 5 pg/ml or • 35 fmol on column
Unlabeled NAD m/z 664 Sample from experiment 1: Nicotinamide at 72 hrs Internal Standard m/z 692 NAD synthesized from labeled nicotinamide m/z 667 100 80 667 60 692 40 20 664 0 100 80 60 40 20 0 100 80 60 40 20 0 8.0 8.5 9.0 9.5 10.0 10.5 11.0 11.5 100 95 90 85 80 75 70 65 60 55 50 45 40 35 30 25 20 15 10 5 0 660 665 670 675 680 685 690 695
Elemental Mass Spectrometry • ICP-MS (inductively coupled plasma) • SIMS-TOF (secondary ion mass spectrometry • CRIMS
ICP-MS (vs. ICP-UV/vis) • ICP (ch 10, pg 231-232) ICP-MS (ch 11) • A spark ignites flowing argon forming a self-sustaining plasma (T ≈ 10000 K) • Sample is aspirated/pumped into plasma forming elemental cations and some simple polyatomic ions • Ions are pushed into mass analyzer by high voltage
Isotope ratio mass spectrometry • Elemental analysis (geologists, archeologist, isotope tracer studies) • High resolution sector mass analyzers • Faraday cups • ThermoFinnigan Neptune http://www.thermo-optek.it/GetBrochure.php?ID=43 • CRI-MS (chemical reaction interface) • Converts all carbon to CO2