Download
1 / 7
70 likes | 178 Views
2012 NHC Proving Ground Products Hurricane Intensity Estimate (HIE) Chris Velden and Tim Olander. Hurricane Intensity Estimates (HIE) {Basically, the ADT}. Real-time evaluation of GOES-R HIE during 2012 Atlantic hurricane season:

E N D
2012 NHC Proving Ground ProductsHurricane Intensity Estimate (HIE)Chris Velden and Tim Olander
Hurricane Intensity Estimates (HIE){Basically, the ADT} • Real-time evaluation of GOES-R HIE during 2012 Atlantic hurricane season: • Will utilize MSG SEVERI imagery on systems east of 60W, and GOES-E CONUS imagery west of 60W • Automatically initiated upon official NHC declaration of tropical cyclone event (depression or greater strength) • Utilizes current ADT version (v8.1.3 w/MW) to ‘simulate’ HIE, with estimates derived every 15 minutes • Further training to be provided at NHC by HIE developers this week • Real-time (and season’s archived cases) HIE estimates available via dedicated webpage at UW-CIMSS: http://cimss.ssec.wisc.edu/tropic2/real-time/adt/goesrPG/adt-PG.html
2012 NHC Proving Ground Products Objective Tropical Overshooting Top (TOT) Detection Algorithm Chris Velden and Sarah Monette
Objective Tropical Overshooting Top (TOT) Detection Algorithm Goal: Adapt the existing CIMSS OT algorithm (Bedka et al.) to tropical applications, and demonstrate for GOES-R readiness Developers: Sarah Monette and Chris Velden (CIMSS) Collaborators: Wayne Feltz, Kris Bedka, Chris Rozoff Motivation:Precise location and timing of tropical cyclone (TC) genesis (TCG) and rapid intensification (RI) are two problematic areas for NHC forecasters. Concept: The TOTs are associated with vigorous tropical convection, and may be employed as a proxy for identifying “vortical hot towers”, hypothesized to be important for TCG and intensity change. Potential Applications: 1) Trends in TOTs can be related to favorable environmental factors for TCG or RI. 2) Marine and Trans-Atlantic aviation convective analyses.
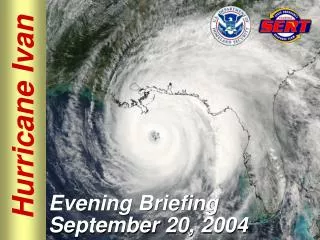
Objective Tropical Overshooting Top (TOT) Detection Algorithm Example: Hurricane Ivan (2004) TOT algorithm technique synopsis: Find relative minima in the GOES 4-km 11 μm BT field colder than 215K. Compute the mean BT of the surrounding anvil cloud. Cloud pixel minima 9K colder than the surrounding anvil are flagged/identified as overshooting tops. Image courtesy of Kristopher Bedka TOT trends can be monitored: Note the spike in the TOTs prior to the RI of Ivan. TOT locations (yellow dots) are obtained for an MSG satellite scan (proxy for GOES-R demo).
Objective Tropical Overshooting Top (TOT) Detection Algorithm Ongoing TOT research>applications: Analysis of TOT trends with respect to TCG began in 2009, and continued in 2010 using data and cases from the Atlantic PREDICT/GRIP experiments. Preliminary findings are promising, however more data are needed to refine results. TOT trends have also been shown to be a promising predictor of RI. Initial testing using an objective logistic regression scheme for RI prediction has shown a modest increase in forecast skill (paper in JAMC accepted). Forecaster feedback and further tuning is needed. Another potential application of TOTs: oceanic aviation and hazard avoidance. Example: TOTs were used to help guide aircraft during PREDICT. On the right, the G-V plane track (red line) deviates to avoid a TOT in the vicinity (purple square, circled).
Objective Tropical Overshooting Top (TOT) Detection Algorithm • Additional training given to TAFB during AMS TC Conf., and during an NHC visit this week. Web pages with further details have been developed and made known to NHC/TAFB. • Real-time evaluation of GOES-R TOT products during the 2012 Atlantic and EPAC hurricane season: • - Utilizes MSG SEVERI IR imagery on systems east of 55W, and GOES IR imagery west of 55W • - Will run continuously, with products derived every 15 minutes • - Tropical disturbances will be followed and nearby TOTs plotted and graphed over time to produce TOT trend analyses for evaluation • - Real-time TOT information will be sent via text files to NHC for N-AWIPS display. Also available via dedicated webpage at UW-CIMSS: • http://cimss.ssec.wisc.edu/goes_r/proving-ground/nhc/ot/