Download
1 / 36
360 likes | 516 Views
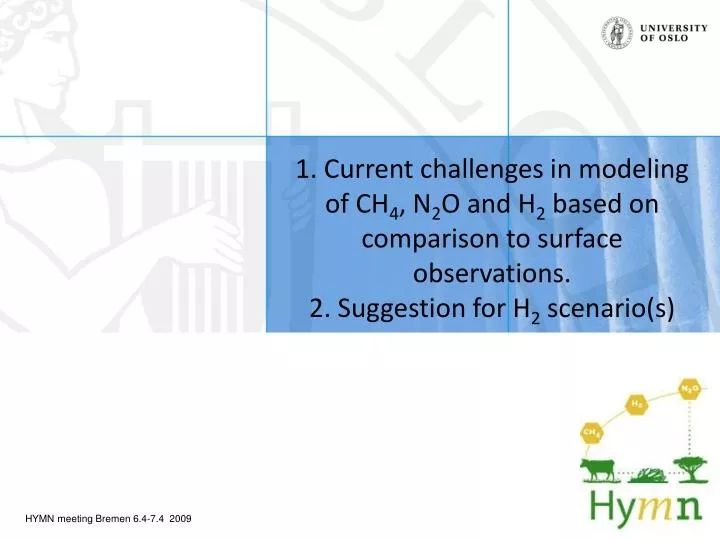
1. Current challenges in modeling of CH 4 , N 2 O and H 2 based on comparison to surface observations. 2. Suggestion for H 2 scenario(s). Methane sensitivity runs for 2003-2004 1st run (Bousquet run) Methane Emissions from Bousquet aposteriori/inversion 2nd run (LPJ run)

E N D
1. Current challenges in modeling of CH4, N2O and H2 based on comparison to surface observations. 2. Suggestion for H2 scenario(s)
Methane sensitivity runs for 2003-2004 1st run (Bousquet run) Methane Emissions from Bousquet aposteriori/inversion 2nd run (LPJ run) Anthropogenic –rice from Bousquet Natural + rice from LPJ (scaled so that anthrop+natural= total 1st run)
Surface Methane March 2004 Oslo CTM2 Bousquet run Oslo CTM2 LPJ run TM4 Bousquet run TM4 LPJ run
OsloCTM2 CH4 March 2004, Bousquet run (upper left corner) Same but natural CH4 isolated (lowe left) Same but anthropogenic CH4 (lower right)
OsloCTM2 (uppper left) TM4 (upper right) OsloCTM2 extra components (lower left)
N2O budget 2004 Loss • Stratospheric loss 18.65 Tg Sources • Biomass burning 0.7 Tg • Anthropogenic 11.28 Tg • Ocean 5.97 Tg • Soil (from LPJ) 11.0 Tg • Burden 2430 Tg
OsloCTM2 March 2004, (upper left corner) Same but ”anthropogenic” N2O isolated (lowe left) Same but natural N2O (lower right)
March 2004 October 2004
Understandingthe hydrogen budgetSimulationsperformed in Eurohydros, workdone by Amund Søvde and Frode Stordal
PRI-2 and SAN-2 for 2006 after 1 year of spinup. Started from the same field (previous SAN-run) EH4 is 2002, started 1. Jan 2000 from SAN-2 field at 1.Jan 2007.
HYM-1 and SAN-1 for 2006 starting from the same field. Started from the same field (previous SAN-run)
Two othermethane studies relevant for HYMN Effect of emission changes in Southeast Asia on global hydroxyl and methane lifetime S. B. Dalsøren, I.S.A. Isaksen, L Li, A. Richter, accepted TELLUS , HYMN acknowledged
HyWays - an integrated project to develop the European Hydrogen Energy Roadmap • Integrated project, co-funded by research institutes, industry and by the European Commission (EC) under the 6th Framework Programme • The project was performed from April 2004 and was finalized in June 2007. • For the timeframes 2020, 2030 and 2050, the aggregated member state specific results for greenhouse gas emissions, preferred hydrogen production and infrastructure technologies, the build-up of supply infrastructure and end-use technologies was integrated into a proposal for an EU Hydrogen Energy Roadmap for the participating areas.
Substantial emission reduction can be achieved in a cost effective way. At the same time, security of supply is improved and new economic opportunities are created. Despite these advantages, initial barriers prevent hydrogen from entering the energy system at a sufficient pace in case no further policy incentives are provided. The Action Plan provides concrete actions that need to be taken with priority in order to overcome smoothly the initial barriers
1000 Base line (-30% CO2) 900 800 Modest policy support, modest learning 700 Mtons/a High policy support, 600 high learning 500 Very high support, high learning 400 300 2000 2010 2020 2030 2040 2050 Emission reduction potential Annual CO2 emissions from European road transport Hydrogen scenarios: • Over 50% reduction of emissions from road transport by 2050.
100% 90% 80% 70% 60% 50% 40% 30% 20% 10% 0% UK PL ES FI NO NL IT GR Countries DE FR Scenarios for reduced vehicle emissions (CO, NOx, PM, NMVOCs, CH4, N2O, CO2) NOx emissions* compared to baseline • 70% reduction by 2050. 2000 2010 2020 2030 2040 2050 * High support, high learning scenario
Hyways only give tank to wheel emissions What about well to tank (Emissions of pollutants during production, transport etc) Hyways lacks Hydrogen emission scenarios (combustion and leakage) from both well to tank and tank to wheel
Switching to a U.S. hydrogen fuel cell vehicle fleet: The resultant change in emissions, energy use, and greenhouse gases W.G. Colella , M.Z. Jacobson, D.M. Golden
Study includingwell to tank and hydrogen Switching to a U.S. hydrogen fuel cell vehicle fleet: The resultant change in emissions, energy use, and greenhouse gases W.G. Colella , M.Z. Jacobson, D.M. Golden, Journal of Power Sources 2005 Cleaning the air and improving health with hydrogen fuel-cell vehicles M.Z. Jacobson, W.G. Colella, D.M. Golden, Science 308 (2005)
Suggestions for sceanrioson hydrogen and European road transport Use HYWAYS best case hydrogen scenario ( for emissionofpollutants from vehicles (tank to wheel) Use U.S. studyinformationonwell to tank emissions Evaluate for eachpollutantiftheseare negligible or not. Use U.S. study to obtainemissionsof hydrogen. (Theyassumeextremelyhighleakageof 10 %, unrealistic, butwe have something to refer to, that is consistentwiththewell to tank estimates for otherpollutants, and wecancall it an upperestimate)
Suggested Simulations • One for year 2000 • One for year 2050 HYWAYS baseline scenario with non-hydrogen vehicles only • One for year 2050 with best case hydrogen scenario • Study both the effects of reduction in CO, Nox…. and the effect of increase/changes in H2 emissions.