Download
1 / 23
230 likes | 303 Views
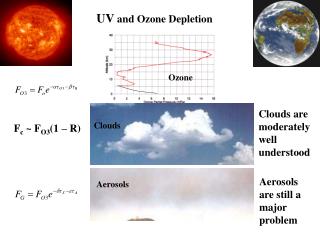
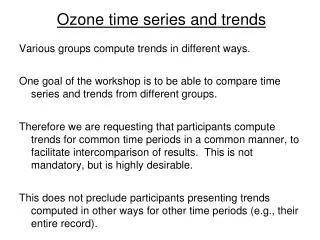
U.K. Ozone and UV Trends and Extreme Events. Andrew C. Moss, Andrew R.D. Smedley and John S. Rimmer University of Manchester. Acknowledgements: UKMO, DEFRA. Introduction. Overview of Sites Long-term Trends in Ozone and UV Statistical Determination of Extreme Events

E N D
U.K. Ozone and UV Trends and Extreme Events Andrew C. Moss, Andrew R.D. Smedleyand John S. Rimmer University of Manchester Acknowledgements: UKMO, DEFRA 13th Biennial WMO-GAW Brewer Workshop, Beijing 2011
Introduction • Overview of Sites • Long-term Trends in Ozone and UV • Statistical Determination of Extreme Events • Extreme Events Determined for: • Lerwick • Manchester • Reading • Comparison with Satellite Records 13th Biennial WMO-GAW Brewer Workshop, Beijing 2011
Overview and Map of Sites • Lerwick: • Dobson since 1952 • Manchester: • Brewer Mk III since 2000 • Reading: • Brewer Mk IV since 2002 • Camborne: • Dobson 1989 – 2003 • Dobson 1952 – 1967 • Bracknell: • Dobson 1967 - 1989 13th Biennial WMO-GAW Brewer Workshop, Beijing 2011
Ground Based TrendsA.R.D. Smedley et al. International Journal of Climatology DOI: 10.1002/joc.2275, 2010 13th Biennial WMO-GAW Brewer Workshop, Beijing 2011
1979 – 1993: • Lerwick ozone: -5.8% per decade. • Southern England ozone: -4.8% per decade. • Decreases at upper end of range in comparison with other European stations. • 1993 – 2008: both sites show small increase but not statistically significant. • Latest – re-analysis 1993-2010 increase becomes statistically significant. 13th Biennial WMO-GAW Brewer Workshop, Beijing 2011
Satellite TrendsA.R.D. Smedley et al. International Journal of Climatology DOI: 10.1002/joc.2275, 2010 13th Biennial WMO-GAW Brewer Workshop, Beijing 2011
UV Ratio Trends ReadingA.R.D. Smedley et al. International Journal of Climatology DOI: 10.1002/joc.2275, 2010 13th Biennial WMO-GAW Brewer Workshop, Beijing 2011
Determination of Extreme Events 13th Biennial WMO-GAW Brewer Workshop, Beijing 2011
Gaussian Quantile-Quantile Plot: Case for Changing Statistical Analysis for Identification of Extreme Events 13th Biennial WMO-GAW Brewer Workshop, Beijing 2011
Extreme Value Theory – Generalized Pareto Distribution Extreme events in total ozone over Arosa: Part 1: Application of Extreme Value Theory. Rieder et al. AtmosChem Phys, 10, 10021, 2010 Extreme events in total ozone over Arosa: Part 2: Fingerprints of atmospheric dynamics and chemistry and effects on mean values and long-term change. Rieder et al. . AtmosChem Phys, 10, 10033, 2010 13th Biennial WMO-GAW Brewer Workshop, Beijing 2011
Determination of Threshold • Fit the GPD model to the data for a range of thresholds. • Find the point where the shape parameter becomes constant. • Check that this threshold does actually provide the best fit. 13th Biennial WMO-GAW Brewer Workshop, Beijing 2011
Quantile-Quantile Comparison 13th Biennial WMO-GAW Brewer Workshop, Beijing 2011
Quantile-Quantile Comparison 13th Biennial WMO-GAW Brewer Workshop, Beijing 2011
Conclusions • Tentative signs of ozone recovery. • Ozone inadequately described by a Gaussian Distribution • EVT fits the extreme tails much better and provides different thresholds • Frequency of extreme events follows overall trend of data as you would expect • Seasonal Frequency loosely follows the same trend generally, however, variations from season to season • Significant difference between extreme event frequency between Lerwick Dobson and satellite. Difference in thresholds. 13th Biennial WMO-GAW Brewer Workshop, Beijing 2011
Thank You! 13th Biennial WMO-GAW Brewer Workshop, Beijing 2011