Download
1 / 41
410 likes | 493 Views
Real-time oceanography and extreme events. David Griffin, Madeleine Cahill and Jim Mansbridge. CSIRO Marine and Atmospheric Research. Median energy flux of ocean currents. 0 Median non-tidal current speed 0.8 (m/s). Median energy flux of ocean currents.

E N D
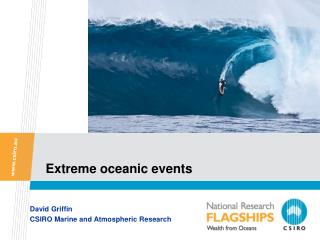
Real-time oceanography and extreme events David Griffin, Madeleine Cahill and Jim Mansbridge. CSIRO Marine and Atmospheric Research
Median energy flux of ocean currents 0 Median non-tidal current speed 0.8 (m/s) Insert presentation title
Median energy flux of ocean currents 0 Median non-tidal current speed 0.8 (m/s) Insert presentation title
CyclonicEddy (Low sealevel) Is it real? Yes, see drifter. Is it extraordinary? Lets look at some history
Maximum (in 1994-2011) gridded altimetric (+ filtered tidegauge) sea level anomaly: +1m SSHA -1m wide range: 0.3m to 1.1m Extraordinarinesscannot be judged from a single SSHA map.
99th percentile anomaly (exceeded 1% of time) NB: 30% less than 100th percentile 0.2m 0.7m +1m SSHA -1m
1st percentile anomaly (exceeded 99% of time) +1m SSHA -1m -0.7m
Minimum elevation (0 %-ile) is 30% more extreme than 1st %-ile -1m Insert presentation title
Maximum anomaly map again.highest highs are south of the lowest lows +1m SSHA -1m Low low High high
Median elevation (50th percentile)near zero – i.e. distribution is fairly symmetric +1m SSHA -1m
CyclonicEddy (Low sealevel) Is it real? Yes, see drifter. Is it extraordinary? Letsuse that history
16 Jan 2011: Many extreme highs and lows 1.5m/s Insert presentation title
Back 4 days (to 12 Jan) Insert presentation title
Back 4 days (to 8 Jan) Insert presentation title
Back 4 days (to 4 Jan) Insert presentation title
Back 4 days (to 31 Dec) Insert presentation title
Back 4 days (to 27 Dec) Insert presentation title
Back 4 days (to 23 Dec) Insert presentation title
That high sea level all along the coast was not a ‘storm surge’ • Coastal sea level was very high. Anomaly of nearshore current was zero. Odd situation – still needs investigation. • Lets now go back to 16 Jan then step forward.
vanishing growing Insert presentation title
So, that’s how a record-breaking East Australian Current warm-core eddy was born • Existence of strong coastal currents obvious to all mariners • What is the link to the extreme La Nina? • The area-average current speed usually has a January maximum off SE Aust: SE Aust 2011 not extreme
Back to the question of quality control: • New approach (for us) to real-time QC: • Reject data by comparing with historic extrema • Eg: at each point in space use only 1.5*min < SSHA <1.5*max • Much more discriminating than spatially invariant limits • But: how do the stats of track data compare with stats of maps?
A: very closely: Min of tracks~= min of maps. Only 1 bad Envisat track in RADS at present: SSHA = -2m (=3*minimum) not edited by standard RADS editing
Max values: Same result
Discussion • It is tempting not to focus on the extreme values in a data set, or to think much about the shape of the distribution function, and how it varies in space. • Extreme values in Near-Real-Time data are often errors: indeed, some erroneous NRT maps were found during the production of this talk. • By definition, the genuine extreme values are rare, and pose a challenge to automatic quality control. • But it is essential not to be lazy here. (Modellers might be reluctant to assimilate unseen values into an operational model). • For operational oceanography to become a reality, we must build systems that do not fail when they are most needed .
Thankyou • We thank the many people and agencies (ESA, EuMetSat, CNES, NASA, NOAA, Argo, Drifter program) for the data shown here. • We look forward to including Altika in similar analyses • …and to getting CryoSat2 data closer to real time • Our URL again: imos.aodn.org.au/oceancurrent