Download
1 / 19
200 likes | 323 Views
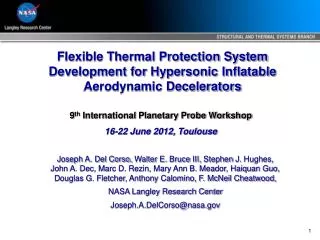
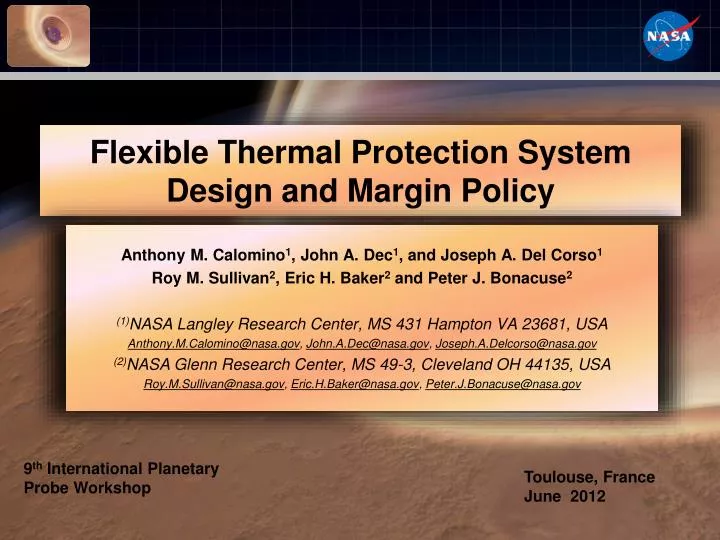
Flexible Thermal Protection System Design and Margin Policy. Anthony M. Calomino 1 , John A. Dec 1 , and Joseph A. Del Corso 1 Roy M. Sullivan 2 , Eric H. Baker 2 and Peter J. Bonacuse 2 (1) NASA Langley Research Center, MS 431 Hampton VA 23681, USA

E N D
Flexible Thermal Protection System Design and Margin Policy Anthony M. Calomino1, John A. Dec1, and Joseph A. Del Corso1 Roy M. Sullivan2, Eric H. Baker2 and Peter J. Bonacuse2 (1)NASA Langley Research Center, MS 431 Hampton VA 23681, USA Anthony.M.Calomino@nasa.gov, John.A.Dec@nasa.gov, Joseph.A.Delcorso@nasa.gov (2)NASA Glenn Research Center, MS 49-3, Cleveland OH 44135, USA Roy.M.Sullivan@nasa.gov, Eric.H.Baker@nasa.gov, Peter.J.Bonacuse@nasa.gov 9th International Planetary Probe Workshop Toulouse, France June 2012
Introduction • Design of Thermal Protection System (TPS) is critical to successful planetary atmospheric entry. • Design of a TPS depends on several analysis stages having inherent and unavoidable uncertainty • Prediction of aerothermal environment • Prediction of material thermal properties • Prediction of material response to environment. • Uncertainty conventionally handled with stacked, conservative margins that are often overly conservative. • Conservative margin policies lead to increased TPS mass. • Improved modeling and increased understanding with rational uncertainty treatment can result in TPS mass fraction reduction.
Thermal Margin Policy Objectives Investigate and reliably model the thermal management mechanisms for f-TPS using physics based formulations. Establish a margins policy for f-TPS that treats model and response uncertainty using a Monte Carlo methods. Couple f-TPS sizing to trajectory dispersion analysis. Predict temperature profile distributions that can be used to establish reliability intervals.
HIAD f-TPS Development Gen 1 TPS Heat Rate Refractory Cloth Insulator Heat Load Gas Barrier Impermeable Film Modular design using functional layers Arc-jet Testing
Flexible Heat Shield Concept Material selected based on temperature, stowage, and handling capability. Capability to manufacture large-scale, >6 m, f-TPS. Utilize commercial manufacturing base with acceptable quality control. 3-m IRVE-3 f-TPS Integrated 3-m f-TPS • Packed 3-m f-TPS
Soft-good Materials • Allow aeroshell to be packed to relatively high density (400 kg/m3) • Allow tight folds and creases without damage to thermal protection system • Allow for accurate and reliably prediction of thermal response. • Deploy after stowage without significant detriment to thermal response. Thermal Protection Layer Materials: Aluminosilicate and silicon carbide cloth, fibrous insulators, aerogels, opacifiers, thin film polyimides
f-TPS Margins Policy Approach f-TPS sizing pipelined within trajectory and aerothermal dispersion analysis Trajectory output Aero-thermal output HEART Trajectory (Aaron Olds) • Predict fixed-time temperature distributions Thermal Sizing model input Monte Carlo • Predict fixed-temperature time distributions +3σ Normal Gamma Lognormal f-TPS Key Property Distribution
f-TPS Thermal Model High fidelity thermal model of flexible f-TPS materials under development using COMSOL q Pyrolysis Gas Mass Continuity Spatial Distribution of Temperatures at Discrete Times Energy Conservation Equation Impermeable gas barrier Radiation Transport Equation Capacitance Conduction Advection Pyrolysis Radiation Thermal model requires the simultaneous, time-accurate solution of three coupled differential equations:
Thermal Model Response • Thermal model validation and verification through ground based arc-jet tests • Shear coupons • Stagnation coupons Arc-jet Shear Testing Model Shear Predictions (IRVE-3) Temp. (°C) vs. time (s) Post-test Sample TC 1 TC 2 TC 3 TC 4 TC 5 Instrumentation
Thermal Model Validation Study 30 W/cm2 30 W/cm2 Cloth layers i1 i1 • • • • Insulation layers i2 i2 i3 i3 Back-side Temperature i4 i4 Gas barrier layer Sample 1 Sample 12 50 mm Stagnation Test • Total test sample size of 50. • Insulation layer weight independent random variable. • Assembled 2 light- and 2 heavy-weight samples to investigate distribution tails. • 12 nominally identical samples selected at random from remaining pool of 46 samples. • Exposure time to a backside temperature of 300°C defined as dependent random variable.
Thickness and Density Distributions Density Thickness +3 -3 +3 -3 Distributions derived from measurements on 16 specimens (48 layers)
Specimens Weight vs. Thickness 64 Layers from 12 Random, 2 Light and 2 Heavy Specimens 73.5 mm nominal diameter Apparent correlation between thickness and areal weight
Thermal Model Validation Results Back-side temperature-time profile (all samples) 109 sec 198 sec 1000 Scatter 800 Light-weight 600 300°C Temperature (°C) 400 Heavy-weight 200 142 seconds average time to a back-side temperature of 300°C 76-second -3 time to a back-side temperature of 300°C 0 50 100 150 200 250 300 350 400 Time (seconds) • Back-side temperature shows strong correlation with weight. • Lightweight → shortest time and heavyweight → longest time • Nominally identical samples weighted toward lightweight result.
Gas Barrier Time to 300°C • Key Difference • Analysis used previous insulator properties • Current insulator similar chemistry/structure but must be characterized. • Model Physics • Sample compression effect • Gas advection • Pyrolysis/decomposition. • Permeability/Diffusivity changes 36 sec • 250 virtual samples analyzed
Conclusions A margin policy assembled for f-TPS that addresses response uncertainty using Monte Carlo techniques. f-TPS thermal response model has been coded within COMSOL using a physics-based formulations. Thermal model shows good correlation with Gen-1 f-TPS response under shear aerothermal loading. Gen-1 f-TPS validation data set will be examined to improve understanding and modeling capability. Additional material measurements are required to improve the fidelity: Acquire properties for new insulator Permeability/diffusivity Pyrolysis/decomposition
Thermal Model Sensitivity • Each parameter varied independently of the other two • One case where all three were set to generate the highest thermal profile • Variation of 25% completely arbitrary (material characterization on-going) 25% Outer Fabric Emissivity 25% Insulator Conductivity 25% Insulator Specific Heat TC 1 TC 2 TC 3 Gas Barrier Back-face Temperature
Insulation Layer Measured Properties Nominal Acreage Diameter: 2.5 in
Insulator Weight Dependence Insulator Mass (g) Heat load (J/cm2) Time to 300°C Heat load and time to 300°C show good dependence on total insulator weight