Download
1 / 28
280 likes | 287 Views
Provide user input for the design of a new weather observation system and understand the impact of CASA data on NWS severe weather warnings. Your feedback will shape the design and operation of the CASA radar network.

E N D
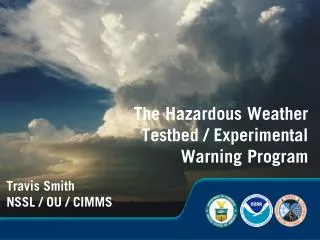
Experimental Warning Project Evaluation of Data: CASA Oklahoma Test Bed Co-PI, Brenda Philips, Univ. of Massachusetts Co-PI, Ellen Bass, Univ. of Virginia Co-PI Jerry Brotzge, University of Oklahoma
Goals • Obtain user input into the design of a new weather observation system • Understand how CASA data from our 4-radar test bed might impact NWS severe weather warnings in light of: • existing sources of information • forecaster interaction with technology Your input is important! Selected feedback will be incorporated into the design and operation of the CASA radar network for evaluation in storm season 2008 and beyond.
Topics • Background on the CASA project and the Oklahoma Test Bed • Differences between CASA radar networks and NEXRAD • Strengths and limitations of CASA network • Evaluation Process
What is CASA? • National Science Foundation Engineering Research Center • Academic, Government and Private Sector Partners • NOAA is a CASA partner • CASA’s Focus: New weather observation system paradigm based on low-power, low-cost networks of radars. • Faculty, students and industry/practitioners work in a multi-disciplinary environment on real-world technology. • Year 5 of a 10-year research project
10,000 ft 3.05 km snow wind tornado earth surface Horz. Scale: 1” = 50 km Vert. Scale: 1” -=- 2 km 0 40 120 160 200 80 240 RANGE (km) gap 4 km 2 km 1 km 5.4 km The problem: we can’t observe the lower troposphere with current technology NEXRAD • 250 km spacing causes coverage gap in lower troposphere • ~ 2 km resolution • 5 min. updates • Radars function autonomously • “Sit and spin” surveillance
10,000 ft 3.05 km snow wind 3.05 km tornado earth surface 0 40 120 160 200 80 240 RANGE (km) CASA’s solution: DCAS, distributed, collaborative, adaptive, sensing • Short range (~ 40 km) radars deployed on cell towers • Lower troposphere coverage • 100’s meter resolution • Rapid scanning as fast as 30 sec. • Adaptive scanning based on user needs, evolving weather “Sensing the Atmosphere where and when user needs are greatest”
Oklahoma Test Bed • 40 km coverage range • 1 minute “smart” VCPs avg. 500m resolution • Real time data • NWS • Emergency Managers • CASA Researchers • Iterative design Radar sites are located in or near the cities of Chickasha (KSAO), Rush Springs (KRSP), Lawton (KLWE), and Cyril (KCYR). Range rings of 30 km are shown. The nearest NEXRAD sites located near test bed are the radars at Twin Lakes (KTLX) and Fredrick (KFDR) and are shown with 30 km and 60 km range rings.
CASA’s Adaptive Sector scanning at multiple elevations from 1 to 14 degrees Situational Awareness & Sector Scans each minute
2. Differences between CASA radar networks and NEXRAD radars
Radar network scans adaptively atmosphere, and sends data to central repository 2. Central Repository disseminates data to users; Detection algorithms identify weather features 3. Weather features are “posted” in Feature Repository user policy ResearchersMedia • Optimal radar scan configuration developed based on: • How Important is a task to users? (User Policy) • What is the quality of the scan? 4. Tasks are generated based on clustering similar weather features.
User Driven Adaptive Scanning Strategy for Spring Experiment 2008 • 1 Minute Heart Beat - Storms • Part 1: Situation Awareness – 20 sec duration • 360 degree surveillance scan for situation awareness at 2 degrees • Part 2: User-Driven Adaptive Sector Scans - 40 sec duration. Determines how important a task is to users. • NWS – high reflectivity, 1 radar, multiple elevations, every 180 secs. • EMs - high reflectivity, 1 radar , lowest elevations every 120 secs. • Storm morphology researcher - high reflectivity, 2+ radars, multiple elevations, every 120 secs. • CASA NWP Researcher • Moderate, 1 radar, all elevations, every 600 secs.. Clear Air Scanning Added for 2008
Optimized Sector scan. The number of lines indicate how many elevations are scanned. Elevation are: 1, 3, 5, 7, 9, 11, 14 degrees 360 degree surveillance scans at 2 degrees. Small squares are weather detections. Larger polygons are potential tasks that could be scanned. Smart VCPs
Merged composite Reflectivity product combines data surveillance and sector scans and is updated each minute Sample image Single radar Coverage area Red circles are radar coverage area Multi radar Coverage area Radar Name
Scanning Strategies for Storm Mode 2 degree tilt always 360
STRENGTHS Strong gradients, high resolution data provides more detailed view of weather signatures: notch, bow echoes, downdrafts, appendages. Sector scans enable rapid analysis of vertical storm structure, especially at lower elevations. Rapid updates allow faster analysis of quickly moving, fast evolving storms. Overlapping coverage provides dual Doppler capability and compensates for attenuation. Dual Polarization CURRENT LIMITATIONS CASA data quality reflects the early stage of test bed deployment; don’t expect WSR-88D data quality at this time. Greater attenuation at x-band. Radar data becomes attenuated in single radar coverage areas. Sector scans based currently based on reflectivity detections, not velocity. Strengths and Current Limitations
Lower troposphere scanning reveals small scale features CASA View of Downdraft ~200m Mini-Circulation Feature Downdraft NEXRAD view of downdraft Downdraft precedes miso-cyclones CASA radar detail of down draft 2007/05/09 - 03:04:06Z
Advantages: Low Level Winds CASA @ 1 deg. ~500 m NEXRAD@ .5 deg. ~1 km g ~65 mph winds Wind Gust of 63 mph reported from Mesonet
NEXRAD CASA V-notch visible in CASA data Funnel Cloud visible in CASA data seen by NEWS9 storm chaser Advantages for warning: 1 Minute updates help to reduce uncertainty
Advantages: Overlapping radar coverage enables Dual-Doppler wind products 2.0 km
With overlapping radar coverage if one radar is attenuated, neighboring radar can cover this high reflectivity area. Attenuation This area is attenuated because it is in the single radar area
Products for Evaluation • Moment Data: • Single radar velocity and reflectivity – sector scans from 1 deg. – 14. deg. • Merged composite reflectivity • RHI Scans • 2-D wind products • Forecasts (post analysis)
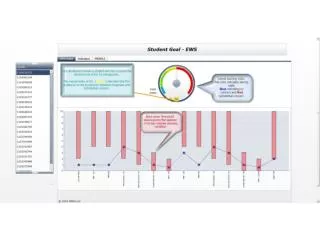
WDSS-II Example Visualization 4 Radar Composite reflectivity NEXRAD Reflectivity NEXRAD Velocity Radar 1 reflectivity Radar 1 velocity Radar 2 reflectivity Radar 2 velocity WDSS-II product displays are configurable
Experimental Warning Project Evaluation Tasks • Evaluation of Real Time Data • Evaluation of archived cases • What weather features do you see in CASA data that would help with severe weather warning decisions? • What are the strengths and weaknesses of CASA’s technical capabilities? • High resolution • Lower troposphere coverage • 1 minute updates • Adaptive Scanning