Download
1 / 91
910 likes | 1.1k Views
Open Trace Format (OTF) Tutorial. Wolfgang E. Nagel, Holger Brunst, T.U. Dresden, Germany Sameer Shende, Allen D. Malony, ParaTools, Inc. http://www.vampir-ng.de otf@paratools.com. Outline. An overview of OTF, TAU and Vampir/VNG OTF Tools API Building trace conversion tools TAU

E N D
Open Trace Format (OTF) Tutorial Wolfgang E. Nagel, Holger Brunst, T.U. Dresden, Germany Sameer Shende, Allen D. Malony, ParaTools, Inc. http://www.vampir-ng.de otf@paratools.com
Outline • An overview of OTF, TAU and Vampir/VNG • OTF • Tools • API • Building trace conversion tools • TAU • Instrumentation • Measurement • Analysis • Scalable Tracing • Vampir • VNG • OTF
Tutorial Goals • This tutorial is intended as an introduction to OTF tools. • Today you should leave here with a better understanding of… • OTF API and tools • Steps involved in building a trace conversion tool to target OTF • How to instrument your programs with TAU to generate OTF • Automatic instrumentation at the routine level and outer loop level • Manual instrumentation at the loop/statement level • Measurement options provided by TAU • Environment variables used for choosing metrics, generating performance data • How to use the Vampir and VNG tools • Nature and types of visualization that VNG provides for visualizing OTF traces
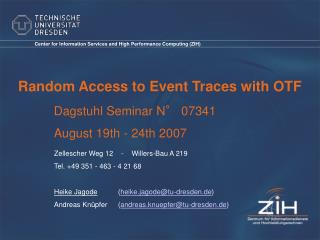
Server Trace 1 Trace 2 Trace 3 Worker 1 Trace N Master Worker 2 Worker m Vampir: Technical Components Tools • Trace generator • Classical Vampir viewer and analyzer • Vampir client viewer • Parallel server engine • Conversion and analysis tools
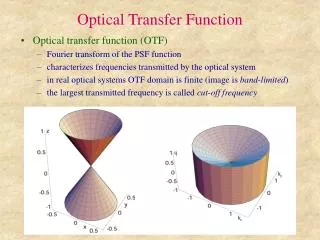
OTF Features • Fast and efficient sequential and parallel access • Platform independent • Selective access to • Processes • Time intervals • API / Interfaces • High level interface for analysis tools • Read/write complete traces with multiple files • Supports filtering and parallel I/O • Low level interface for trace libraries
Relative File Size Better
Read Performance Better
Performance Scalability Better
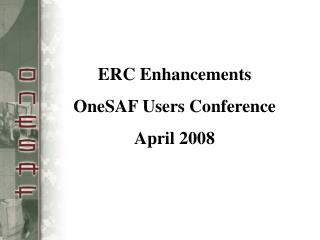
Parallel Program File System Analysis Server MergedTraces Worker 1 Master Classic Analysis: • monolithic • sequential Trace 1 Worker 2 Trace 2 Trace 3 Trace N Worker m Internet Visualization Client Vampir Server Workflow Monitor System (TAU/Kojak) Event Streams Message Passing ParallelI/O Process Timeline with 16 visible Traces Segment Indicator 768 Processes Thumbnail
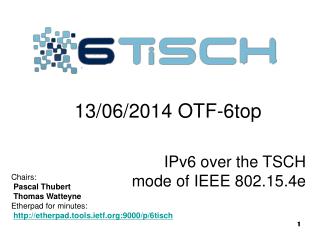
Worker Master Message Passing Message Passing Worker 1 Master Session Thread Session Thread Worker 2 Analysis Module Analysis Merger Worker m Visualization Client Event Databases Endian Conversion Traces Trace Format Driver Socket Communication N Session Threads N Session Threads M Worker Organization of Parallel Analysis
Scalability – sPPM Analyzed on Origin 2000 • sPPM ASCI Benchmark • 3D Gas Dynamic • Data to be analyzed • 16 Processes • 200 MByte Volume
A Fairly Large Test Case • IRS ASCI Benchmark • Implicit Radiation Solver • Data to be analyzed: • 64 Processes in8 Streams • Approx.800.000.000 Events • 40 GByte Data Volume • Analysis Platform: • Jump.fz-juelich.de • 41 IBM p690 nodes (32 processors per node) • 128 GByte per node • Visualization Platform: • Remote Laptop
Outline • An overview of OTF, TAU and Vampir/VNG • OTF • Tools • API • Building trace conversion tools • TAU • Instrumentation • Measurement • Analysis • Scalable Tracing • Vampir • VNG • OTF
OTF Contents • Definition records • Map event ids to interval (begin/end) event names • Symbols for atomic events • Process groups • Performance events • Timestamped events for entering or leaving a state • Timestamped counter events (monotonically increasing or not) • Global master file • Mapping processes to streams • Statistical Summaries • Overview over a whole interval of time • Snapshots • Callstack, list of pending messages, etc. at a point in time
otfmerge • Allows an existing OTF trace to alter the number of streams • Add snapshots or statistics to the merged trace file • otfmerge - converter program of OTF library. otfmerge [Options] <input file name> options: -h, --help show this help message -n <n> set number of streams for output -f <n> set max number of filehandles available -o <name> namestub of the output file (default ’out’) -rb <size> set buffersize of the reader -wb <size> set buffersize of the writer -stats cover statistics too -snaps cover snapshots too -V show OTF version
OTF Tools: otfaux • otfaux • Adds auxillary snapshot and/or statistics information to the trace file • Snapshots include callstack, pending messages, current counter values • Statistics include number of calls, exclusive/inclusive time • Statistics are monotonically increasing - unlike profiles • Original event trace is unmodified • Auxillary data is generated at breakpoints -periodically or at ticks
otfaux • otfaux - append snapshots and statistics to existing otf traces at given ’break’ time stamps otfaux [Options] <file name> Options: -h, --help show this help message -b <size> buffer size for read and write operations -n <n> number of breaks (distributed regularly) if -p and -t are not set, the default for -n is 200 breaks -p <p> create break every ’p’ ticks (if both, -n and -p are specified the one producing more breaks wins) -t <t> define (additional) break at given time stamp -F force overwrite old snapshots and statistics -R delete existing snapshots and statistics only -f <n> max number of filehandles output ...
otfaux (contd.) -g create functiongroup summaries instead of function summaries -v verbose mode, print break time stamps -V show OTF version -a show advancing progress during operation -- snapshots write ONLY snapshots but NO statistics --statistics write ONLY statistics but NO snapshots -s a[,b]* regard given streams only when computing statistics. expects a single token or comma separated list. this implies the ’--statistics’ option! -l list existing stream tokens
tau2otf • Converts TAU traces to OTF • tau2otf <TAU trace> <edf file> <out file> [-n streams] [-nomessage] [-z] [-v] -n <streams> : Specifies the number of output streams (default 1) -nomessage : Suppress printing of message information in the trace -z : Enable compression of trace files. By default it is uncompressed. -v : Verbose Trace format of <out file> is OTF % tau2otf merged.trc tau.edf app.otf
vtf2otf • Convert VTF traces to OTF format • vtf2otf [Options] <input file name> Options: -o <file> output file -f <n> max count of filehandles -n <n> output stream count -b <n> size of the writer buffer -V show OTF version
otf2vtf • Convert OTF trace files to VTF format • otf2vtf [Options] <input file name> Options: -o <file> output file -b <n> size of the reader buffer -A write VTF3 ASCII sub-format (default) -B write VTF3 binary sub-format -V show OTF version
Building Trace Analysis Tools • Writing OTF traces in trace conversion tools • High level API writes multiple streams • Low level API writes a single stream • Each OTF file has a prefix (e.g., app.otf) • Parallel reading and searching in OTF analysis tools • Each process in tool reads local and global event definitions • Each process reads a subset of events • Read summary information to select interesting spots in trace • Tool might read a selected time interval for analysis • OTF supports efficient binary search • Tool may support for compressed or uncompressed OTF trace • Tool may support for single or multi-stream OTF traces
OTF Trace Writer API - OTF_FileManager_open • Generates a new file manager with a maximum number of files that are allowed to be open simultaneously • OTF_FileManager* OTF_FileManager_open( uint32_t number ); #include <otf.h> OTF_FileManager *manager; manager = OTF_FileManager_open(256);
OTF_FileManager_close • Closes the file manager • void OTF_FileManager_close( OTF_FileManager* m ); #include <otf.h> OTF_FileManager_close(manager);
OTF_Writer_open • Define file control block for output trace file • OTF_Writer* OTF_Writer_open( char* fileNamePrefix, uint32_t numberOfStreams, OTF_FileManager* fileManager ); #include <otf.h> void *fcb = (void *) OTF_Writer_open(out_file, num_streams, manager);
OTF_Writer_setCompression • Enable compression if specified by the user • int OTF_Writer_setCompression( OTF_Writer* writer, OTF_FileCompression); #include <otf.h> OTF_Writer_setCompression((OTF_Writer *)fcb, OTF_FILECOMPRESSION_COMPRESSED);
OTF_Writer_writeDefCreator • Specify a comment about the creator (trace conversion tool) • int OTF_Handler_DefCreator( void* userData, uint32_t stream, /* stream = 0 means global definition */ const char* creator ); #include <otf.h> OTF_Handler_DefCreator(fcb, 0, “MyTool2otf ver 2.42”);
OTF_Writer_writeDefProcess • Write a process definition record • int OTF_Writer_writeDefProcess( OTF_Writer* writer, uint32_t stream, uint32_t process, const char* name, uint32_t parent ); #include <otf.h> OTF_Writer_writeDefProcess( (OTF_Writer *)fcb, 0, cpuid, name, 0);
OTF_Writer_writeDefTimerResolution • Provides the timer resolution. All timestamps are interpreted based on this resolution. By default it is 1 microseconds. • int OTF_Writer_write_DefTimerResolution( void* userData, uint32_t stream, uint64_t ticksPerSecond ); #include <otf.h> OTF_Writer_writeDefTimerResolution((OTF_Writer*) userData, 0, getTicksPerSecond());
OTF_Writer_write_DefFunction • Provide a function definition and specify an event id to name mapping • int OTF_Writer_write_DefFunction( void* userData, uint32_t stream, uint32_t func, const char* name, uint32_t funcGroup, uint32_t source ); /* specify source code location */ #include <otf.h> OTF_Writer_writeDefFunction((OTF_Writer*)userData, 0, eventID, (const char *) name, groupID, 0);
OTF_Writer_writeDefFunctionGroup • Provides a function group definition • int OTF_Handler_DefFunctionGroup( void* userData, uint32_t stream, uint32_t funcGroup, const char* name ); #include <otf.h>OTF_Writer_writeDefFunctionGroup((OTF_Writer*)userData, 0, groupId, GroupName);
OTF_Writer_writeEnter • Write a function entry record • int OTF_Writer_writeEnter( OTF_Writer* writer, uint64_t time, uint32_t function, uint32_t process, uint32_t source ); #include <otf.h> OTF_Writer_writeEnter((OTF_Writer*)userData, GetClockTicksInGHz(time), stateid, cpuid, 0);
int OTF_Writer_writeSendMsg • Write a send message record • int OTF_Writer_writeSendMsg( OTF_Writer* writer, uint64_t time, uint32_t sender, uint32_t receiver, uint32_t procGroup, uint32_t tag, uint32_t length, uint32_t source );
int OTF_Writer_writeRecvMsg • Write a receive message record • int OTF_Writer_writeRecvMsg( OTF_Writer* writer, uint64_t time, uint32_t receiver, uint32_t sender, uint32_t procGroup, uint32_t tag, uint32_t length, uint32_t source );
OTF Trace Reader API • Similar to trace writer API • Instead of Write, create a Handler for callbacks, e.g., • int OTF_Handler_DefFunction( void* userData, uint32_t stream, uint32_t func, const char* name, uint32_t funcGroup, uint32_t source );
Building OTF Analysis Tools • Header files are in <otf-version>/include directory • Libraries are in <otf-version>/<arch>/lib directory • Support for Zlib (v1.2.3) is included in libotf.a % g++ tool.cpp -I<otf-version>/include % g++ tool.o -o tool -L<otf-version>/<arch>/lib -lotf
Outline • An overview of OTF, TAU and Vampir/VNG • OTF • Tools • API • Building trace conversion tools • TAU • Instrumentation • Measurement • Analysis • Scalable Tracing • Vampir • VNG • OTF
TAU Parallel Performance System • http://www.cs.uoregon.edu/research/tau/ • Multi-level performance instrumentation • Multi-language automatic source instrumentation • Flexible and configurable performance measurement • Widely-ported parallel performance profiling system • Computer system architectures and operating systems • Different programming languages and compilers • Support for multiple parallel programming paradigms • Multi-threading, message passing, mixed-mode, hybrid • Integration in complex software, systems, applications
Using TAU: A brief Introduction • To instrument source code, choose measurement module: % setenv TAU_MAKEFILE /usr/tau-2.16/x86_64/lib/Makefile.tau-mpi-pdt-trace-pgi And use tau_f90.sh, tau_cxx.sh or tau_cc.sh as Fortran, C++ or C compilers: % mpif90 foo.f90 changes to % tau_f90.sh foo.f90 • Execute application and then run: % tau_treemerge.pl % tau2otf tau.trc tau.edf app.otf % vampir app.otf
TAU Performance System Architecture event selection
Program Database Toolkit (PDT) Application / Library C / C++ parser Fortran parser F77/90/95 Program documentation PDBhtml Application component glue IL IL SILOON C / C++ IL analyzer Fortran IL analyzer C++ / F90/95 interoperability CHASM Program Database Files Automatic source instrumentation TAU_instr DUCTAPE
TAU Instrumentation Approach • Support for standard program events • Routines • Classes and templates • Statement-level blocks • Support for user-defined events • Begin/End events (“user-defined timers”) • Atomic events (e.g., size of memory allocated/freed) • Selection of event statistics • Support definition of “semantic” entities for mapping • Support for event groups • Instrumentation optimization (eliminate instrumentation in lightweight routines)
TAU Instrumentation • Flexible instrumentation mechanisms at multiple levels • Source code • manual (TAU API, TAU Component API) • automatic • C, C++, F77/90/95 (Program Database Toolkit (PDT)) • OpenMP (directive rewriting (Opari), POMP spec) • Object code • pre-instrumented libraries (e.g., MPI using PMPI) • statically-linked and dynamically-linked • Executable code • dynamic instrumentation (pre-execution) (DynInstAPI) • virtual machine instrumentation (e.g., Java using JVMPI) • Python interpreter based instrumentation at runtime • Proxy Components
TAU Measurement Approach • Portable and scalable parallel profiling solution • Multiple profiling types and options • Event selection and control (enabling/disabling, throttling) • Online profile access and sampling • Online performance profile overhead compensation • Portable and scalable parallel tracing solution • Trace translation to Open Trace Format (OTF) • Trace streams and hierarchical trace merging • Robust timing and hardware performance support • Multiple counters (hardware, user-defined, system) • Performance measurement for CCA component software
Using TAU • Configuration • Instrumentation • Manual • MPI – Wrapper interposition library • PDT- Source rewriting for C,C++, F77/90/95 • OpenMP – Directive rewriting • Component based instrumentation – Proxy components • Binary Instrumentation • DyninstAPI – Runtime Instrumentation/Rewriting binary • Java – Runtime instrumentation • Python – Runtime instrumentation • Measurement • Performance Analysis