Download
1 / 17
170 likes | 274 Views
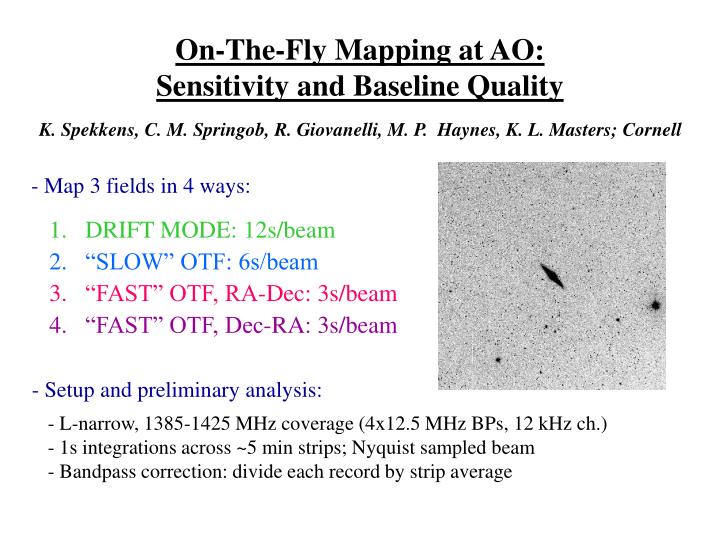
On-The-Fly Mapping at AO: Sensitivity and Baseline Quality. K. Spekkens, C. M. Springob, R. Giovanelli, M. P. Haynes, K. L. Masters; Cornell. - Map 3 fields in 4 ways:. DRIFT MODE: 12s/beam “SLOW” OTF: 6s/beam “FAST” OTF, RA-Dec: 3s/beam “FAST” OTF, Dec-RA: 3s/beam.

E N D
On-The-Fly Mapping at AO: Sensitivity and Baseline Quality K. Spekkens, C. M. Springob, R. Giovanelli, M. P. Haynes, K. L. Masters; Cornell - Map 3 fields in 4 ways: • DRIFT MODE: 12s/beam • “SLOW” OTF: 6s/beam • “FAST” OTF, RA-Dec: 3s/beam • “FAST” OTF, Dec-RA: 3s/beam - Setup and preliminary analysis: • L-narrow, 1385-1425 MHz coverage (4x12.5 MHz BPs, 12 kHz ch.) • 1s integrations across ~5 min strips; Nyquist sampled beam • Bandpass correction: divide each record by strip average
Sensitivity Across a Strip – Drift vs. “Slow” OTF DRIFT “SLOW” OTF 1s integrations 1415 – 1419 MHz 1421 – 1425 MHz 1405 – 1415 MHz 1s int. + Hanning smooth in freq.
Sensitivity Across a Strip – “Fast” OTF Dec-RA RA-Dec 1s integrations 1415 – 1419 MHz 1421 – 1425 MHz 1405 – 1415 MHz 1s int. + Hanning smooth in freq.
Intensity (x Tsys) Baseline Quality – “Fast” OTF Dec-RA Map Raw spectrum: 1s integration 3s average: rms/beam 3s average + Hanning smooth
Baseline Quality – Power Spectrum High freq. Low freq. Raw spectrum: 1s integration 3s average: rms/beam 3s average + Hanning smooth
High freq. Low freq. Baseline Quality – Average Power Raw spectrum: 1s integration 3s average: rms/beam 3s average + Hanning smooth
OTF Mapping: Sensitivity and Baseline Quality For all methods (Drift, “slow” OTF , “fast” OTF): • Theoretical sensitivity limit achieved; no trend in RMS across strip • “Flat” baselines: no harmonics in power spectrum Map sensitivity and baseline quality independent of mapping technique
Baseline Quality – “Fast” OTF RA-Dec Map Raw spectrum: 1s integration 3s average: rms/beam Intensity (x Tsys) 3s average + Hanning smooth
Baseline Quality – Power Spectrum High freq. Low freq. Raw spectrum: 1s integration 3s average: rms/beam 3s average + Hanning smooth
Baseline Quality – Average Power High freq. Low freq. Raw spectrum: 1s integration 3s average: rms/beam 3s average + Hanning smooth
Baseline Quality – “Slow” OTF Map Raw spectrum: 1s integration 6s average: rms/beam Intensity (x Tsys) 6s average + Hanning smooth
Baseline Quality – Power Spectrum High freq. Low freq. Raw spectrum: 1s integration 6s average: rms/beam 6s average + Hanning smooth
Baseline Quality – Average Power High freq. Low freq. Raw spectrum: 1s integration 6s average: rms/beam 6s average + Hanning smooth
Baseline Quality – Drift Map Raw spectrum: 1s integration 12s average: rms/beam Intensity (x Tsys) 12s average + Hanning smooth
Baseline Quality – Power Spectrum High freq. Low freq. Raw spectrum: 1s integration 12s average: rms/beam 12s average + Hanning smooth
Baseline Quality – Average Power High freq. Low freq. Raw spectrum: 1s integration 12s average: rms/beam 12s average + Hanning smooth