Download
1 / 40
870 likes | 2k Views
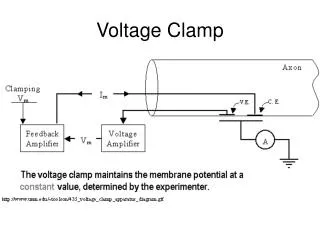
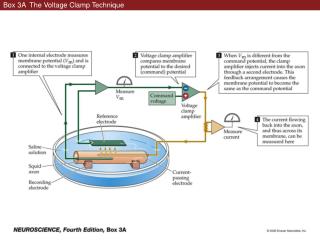
Box 3A The Voltage Clamp Technique. Box 3A The Voltage Clamp Technique. Figure 3.1 Current flow across a squid axon membrane during a voltage clamp experiment. Figure 3.1 Current flow across a squid axon membrane during a voltage clamp experiment (Part 1).

E N D
Figure 3.1 Current flow across a squid axon membrane during a voltage clamp experiment
Figure 3.1 Current flow across a squid axon membrane during a voltage clamp experiment (Part 1)
Figure 3.1 Current flow across a squid axon membrane during a voltage clamp experiment (Part 2)
Figure 3.2 Current produced by membrane depolarizations to several different potentials
Figure 3.2 Current produced by membrane depolarizations to several different potentials (Part 1)
Figure 3.2 Current produced by membrane depolarizations to several different potentials (Part 2)
Figure 3.3 Relationship between current amplitude and membrane potential
Figure 3.5 Pharmacological separation of Na+ and K+ currents
Figure 3.6 Membrane conductance changes underlying the action potential are time- and voltage-dependent
Figure 3.6 Membrane conductance changes underlying the action potential are time- and voltage-dependent (Part 1)
Figure 3.6 Membrane conductance changes underlying the action potential are time- and voltage-dependent (Part 2)
Figure 3.6 Membrane conductance changes underlying the action potential are time- and voltage-dependent (Part 3)
Figure 3.6 Membrane conductance changes underlying the action potential are time- and voltage-dependent (Part 4)
Figure 3.7 Depolarization increases Na+ and K+ conductances of the squid giant axon
Figure 3.8 Mathematical reconstruction of the action potential
Figure 3.8 Mathematical reconstruction of the action potential (Part 1)
Figure 3.8 Mathematical reconstruction of the action potential (Part 2)
Figure 3.8 Mathematical reconstruction of the action potential (Part 3)
Figure 3.9 Feedback cycles responsible for membrane potential changes during an action potential
Figure 3.12 Action potential conduction requires both active and passive current flow
Figure 3.12 Action potential conduction requires both active and passive current flow (Part 1)
Figure 3.12 Action potential conduction requires both active and passive current flow (Part 2)
Figure 3.13 Saltatory action potential conduction along a myelinated axon
Figure 3.13 Saltatory action potential conduction along a myelinated axon (Part 1)
Figure 3.13 Saltatory action potential conduction along a myelinated axon (Part 2)
Figure 3.13 Saltatory action potential conduction along a myelinated axon (Part 3)
Figure 3.14 Speed of action potential conduction in unmyelinated versus myelinated axons
Figure 3.14 Speed of action potential conduction in unmyelinated versus myelinated axons (Part 1)
Figure 3.14 Speed of action potential conduction in unmyelinated versus myelinated axons (Part 2)
Figure 3.14 Speed of action potential conduction in unmyelinated versus myelinated axons (Part 3)