Download
1 / 25
250 likes | 405 Views
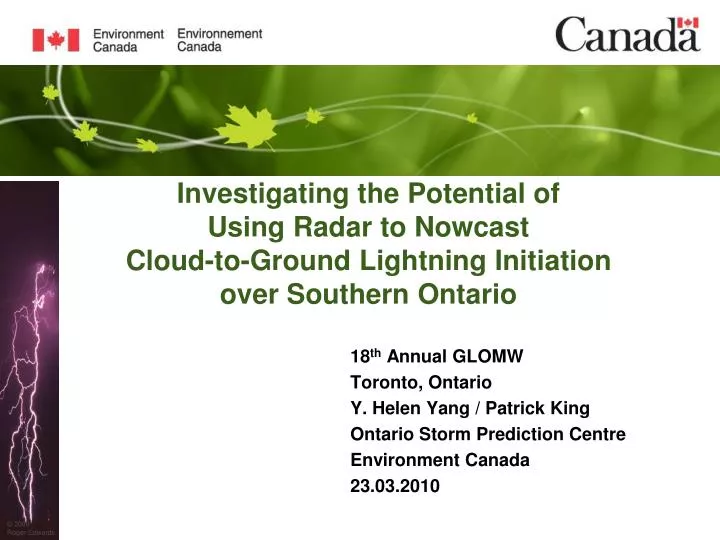
Investigating the Potential of Using Radar to Nowcast Cloud-to-Ground Lightning Initiation over Southern Ontario. 18 th Annual GLOMW Toronto, Ontario Y. Helen Yang / Patrick King Ontario Storm Prediction Centre Environment Canada 23.03.2010. Motivation.

E N D
Investigating the Potential of Using Radar to Nowcast Cloud-to-Ground Lightning Initiation over Southern Ontario 18th Annual GLOMW Toronto, Ontario Y. Helen Yang / Patrick King Ontario Storm Prediction Centre Environment Canada 23.03.2010
Motivation Lightning is a high-impact weather phenomenon! timely & accurately forecast lightning future lightning watch/warning products in Canada? 9-10 deaths & 92-164 injuries in Canada each year! (Mills et al. 2008)
Purpose • To find any correlation between radar echo tops and CG lightning initiation • To investigate the potential use of radar echoes in nowcasting cloud-to-ground (CG) lightning initiation • To study differences (if any) between negative and positive CG lightning initiation in terms of radar characteristics • To determine a reflectivity threshold value that best predicts the onset of CG lightning
Data Lightning data from CLDN Detection efficiency ≥ 90%; location accuracy within 0.5 km • Radar data from URP • Horizontal resolution ~ 1 km • Temporal resolution ~ 10 min • Data from the King City Radar (WKR) only • Domain of study
Data ‘Airmass’ thunderstorms • 143 cases of airmass thunderstorms from Jun-Aug 2008 • A ‘case’ consists of one cell or a cluster of cells on a radar display that may or may not eventually produce lightning
Methods: the premise Graupel-ice mechanism for cloud electrification • occur in the mixed-phase region in or near a storm updraft • rebounding ice crystals tend to become positively charged, while graupel particles become negatively charged • larger riming graupel and smaller ice crystals collide, and consequently electric charges are exchanged by these hydrometeors
Methods: the premise cloud electrification within a storm updraft main negative charge region -20°C -10°C ice crystals • in mixed-phase layer • constant altitudes • where CG lightning is often initiated graupel particles (MacGorman and Rust 1998)
Methods upper air sounding data altitude?? temperature • What reflectivity threshold value at which temperature level can best predict the onset of CG lightning? • Recall one of the objectives from earlier…
Methods: x-section of a case 2200Z 18 Aug 2008 -20°C -15°C -10°C 2140Z 18 Aug 2008 2130Z 18 Aug 2008 2120Z 18 Aug 2008 Hit (H) Miss (M) False (FA) Alarm Lead time [min]
Findings: reflectivity threshold POD [%] FAR [%]
Findings: reflectivity threshold CSI [%] ave. lead time Average lead time [min] (±5 min) FAR
Findings: echo top threshold Things to keep in mind: • Higher echo tops stronger updrafts • Weak updrafts cannot produce intense electrification needed to generate lightning • Echo tops of convections on warmer days higher than those during cooler days • Echo tops in relation to only warm season lightning
Findings: echo top threshold Maximum echo top prior to or at the start of CG lightning activity altitude of 7 km ~ -13 to -29°C levels
Findings: vs Things to keep in mind: 6 77 • small sample size • Cases with both polarities were counted towards both ‘-’ and ‘+’ cases
Findings: vs Initial lightning flash location to storm location of maximum reflectivity on MAXR [km] x
Findings: vs Initial lightning flash location to storm location of maximum reflectivity on MAXR [km] storm location of max. reflectivity highly-reflective graupel concentrated main negative charge cloud region (± 0.5)
Findings: vs Reflectivity threshold predictors ? P O D F A R C S I
Findings: vs Reflectivity threshold predictors Average lead time [min] (±5 min) green = ‘-’ first lightning flashes red = ‘+’ first lightning flashes
Findings: summary -10ºC / 40 dBZ could best predict the onset of CG lightning POD=88% FAR=16% CSI=76% Lead time ~ 17±5 minutes • Trade-off between the lead time and FAR • Echo tops ≥ 7 km • used in conjunction with reflectivity threshold to improve accuracy • Above results are supported by other studies • e.g., Krehbiel 1986;Gremillion and Orville 1999; Vincent et al. 2004;Wolf 2007
Findings: summary Negative vs. positive first lightning flashes • Negative flashes were located closer to the main negative charge region in a storm cloud • No definitive difference in skills to forecast lightning of different polarities • Positive-first-lightning-producing storm clouds became strongly electrified faster than negative-lightning-producing storm clouds
Conclusions Potential to use radar echo reflectivity to nowcast CG lightning initiation • Much more work is needed in developing a lightning nowcast algorithm in a future nowcasting software application tool
Thanks National Laboratory for Nowcasting & Remote Sensing Meteorology Ontario Storm Prediction Centre Ed Becker, Glenn Robinson, Paul Joe, Norman Donaldson, Dave Hudak, and Syd Peel the End
Outline Why… • What findings… • What purpose… • What conclusions… • Thanks to… • How…
What findings… vs Magnitude of electric current [kA]
Methods Average altitudes corresponding to different temperature levels for the time periods examined in the study