Download
1 / 27
270 likes | 421 Views
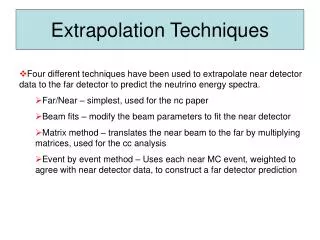
Extrapolation Pitfalls When Evaluating Limited Endurance Memory. Tinker Research. Rishiraj Bheda, Jesse Beu , Brian Railing, Tom Conte. Need for New Memory Technology. DRAM density scalability problems Capacitive cells formed via ‘wells’ in silicon More difficult as feature size decreases.

E N D
Extrapolation Pitfalls When Evaluating Limited Endurance Memory Tinker Research Rishiraj Bheda, Jesse Beu, Brian Railing, Tom Conte
Need for New Memory Technology • DRAM density scalability problems • Capacitive cells formed via ‘wells’ in silicon • More difficult as feature size decreases. • DRAM energy scalability problems • Capacitive cells leak charge over time • Require periodic refreshing of cells to maintain value
High Density Memories • Magento-resistive RAM – MRAM • Free magnetic layer’s polarity stops flipping • ~1015 writes • Ferro-electric RAM – FeRam • Ferrous material degradation • ~109 writes • Phase Change Memory – PCM • Metal fatigue from heating/cooling • ~108 writes
Background - Addressing Wear Out • For viable DRAM replacement, mean time to failure (MTTF) must be increased • Common solutions include • Write filtering • Wear leveling • Write prevention
Write Filtering • General rule of thumb, combine multiple writes • Caching mechanisms filter access stream, capturing multiple writes to the same location, merge into single event • Write buffers • On-chip caches • DRAM pre-access caches (Qureshi et al.) • Not to be confused with write prevention (bit-wise)
Write Filtering Example ProcessorWrite Stream $ Filtered Stream DRAM Cache L2 Cache Mem Con
Write Prevention • General rule of thumb, bitwise comparison techniques to reduce write • Ex: Flip-and-write • Pick shorter hamming distance between natural and inverted versions of data, then write.
1 0 0 0 0 0 0 0 0 Write Prevention Example 1 1 1 1 1 1 1 0 0 0 0 0 0 0 0 0 0 1 1 1 1 1 1 1 1 0 0 0 0 0 0 0 0 1 0 0 0 0 0 0 0 0 00000010 00000001 00000000 11111111 11111110 0 0 0 0 0 0 0 1 X Σ 2 7 1 8 0 0 0 0 0 0 0 1 0
Write Leveling • General rule of thumb – Spread out accesses to remove wear-out ‘hotspots’ • Powerful technique when correctly applied • Uniform wearing of the device • The larger the device, the longer the MTTF • Multi-grain Opportunity • Word-level - Low-order bits have higher variation • Page-level - Low numbers blocks written to more often • Application-level – few high activity ‘hot’ pages
Overview • Background • Extrapolation pitfalls • Impact of OS • Memory Sizing and Page Faults • Estimates over multiple runs • Line Write Profile • Core take away of this work
Extrapolation Pitfalls • Single run extrapolation, OS and long-term scope • Natural wear leveling from paging system • Interaction of multiple running processes • Process creation and termination • A single, isolated run is not representative! • Main memory sizing and impact of high density • Benchmark ‘region of interest’ • Several solutions exist (sampling, simpoints, etc.)
OS Paging • Goal • Have enough free pages to meet new demand • Balanced against utilization of capacity • Solution • Actively used pages keep valid translations • Inactive pages migrate to free list; reclaimed for future use Reclamation shuffles translations over time!
Main Memory Sizing • Artificially high page fault frequency when simulating with too little • Collision behavior can be wildly different • Impact on write prevention results
MTTF improvement with size • Unreasonable to assume device failure with first cell failure • Device degradation vs. failure • Larger device takes longer to degrade • Even better in the presence of wear leveling • More memory means more physical locations to apply wear leveling across • Assuming write frequency is fixed*, increase in size means proportional increase in MTTF
How much does this all matter? • Short version – a lot • Two Consecutive runs increase max write estimate by only 12%, not 100%
Higher Execution Count • Non-linear behavior over many more executions • Sawtooth-like pattern due to write-spike collisions • Lifetime estimates in years instead of months!
How should we estimate lifetime? • Running even a single execution of a benchmark can become prohibitively expensive • Apply sampling to extract benchmark write behavior • Heuristic should be able to approximate lifetime after many many execution iterations • Line Write Profile holds the key
Line Write Profile • Can be viewed as a superposition of all page write profiles • Line Write Profile provides a summary of write behavior Physical Address Page ID Line ID Line Offset Line ID
Line Write Profile • For every write access to physical memory • Extract LineID • For a Last Level Cache with Line Size of 64 Bytes • A 4KB OS Page contains 64 cache lines • Use a counter for each of these 64 lines • Increment counter by 1 for every write that reaches main memory
Using Line Write Profile • As the number of runs approaches infinity • If every physical memory page has equal chances of being accessed, then • Every physical page tends towards the same write profile • At this point, the lifetime curve reaches a settling point • The maximum value from the Line Write Profile can then be used to accurately estimate lifetime in the presence of an OS.
So is wear endurance is a myth? • Short answer – no • Applications that pin physical pages will not exhibit natural OS wear leveling • Security threats are still an issue • And the OS can easily be bypassed to void warranty • Hardware wear leveling solutions can be low cost and effective
Final Take Away • Wear endurance research should not report results that do not take multi-execution, inter-process and intra-process OS paging effects into account. • Techniques that depend on data (write prevention) should carefully consider appropriate memory sizing and page fault impact • Ignoring these can result in grossly underestimating baseline lifetimes and/or grossly overestimating lifetime improvement.
Thank You Questions?